3,072
Views
1
CrossRef citations to date
0
Altmetric
Articles

Conversation success in one-to-one and group conversation: a group concept mapping study of adults with normal and impaired hearing

ORCID Icon, ORCID Icon, ORCID Icon, ORCID Icon & ORCID Icon
Pages 868-876 | Received 01 Apr 2022, Accepted 24 Jun 2022, Published online: 23 Jul 2022

Figures & data

Table 1. Demographics and participation rates.

Figure 1. The cluster map depicting seven clusters of conversation success. The number of layers represents the rating of overall importance given to each cluster.

Figure 1. The cluster map depicting seven clusters of conversation success. The number of layers represents the rating of overall importance given to each cluster.

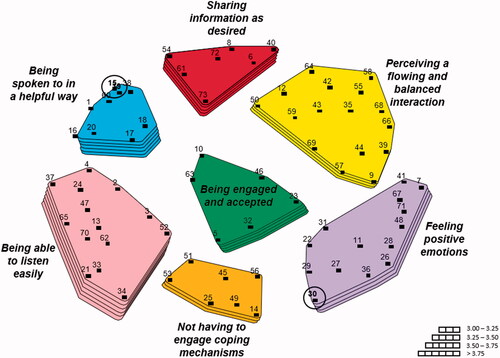
Table 2. Seven clusters representing factors that can lead to conversation success, a brief description, and examples of statements for each cluster.

Figure 2. Laddergram showing differences between cluster averages per type of conversation for participants with normal and impaired hearing.

Figure 2. Laddergram showing differences between cluster averages per type of conversation for participants with normal and impaired hearing.

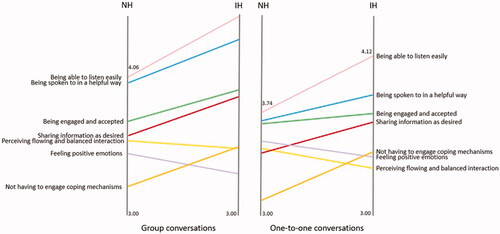
Table 3. Tukey p values for significant differences between clusters for each conversation type.

Supplemental material

Supplemental Material

Download MS Word (18.8 KB)