Figures & data
Figure 1. Example PFs from three participants (panels A–C). Each panel shows the percentage correct score for a tested ICD (blue dots), the PF fitted to the data points (black line), predicted asymptotes (dotted lines), the threshold at 67% correct, and the 95% credibility interval of the threshold (bar-and-whiskers). Panels (A and B) show good performers, and panel (C) shows a relatively poor performer (also note the wider range on the abscissa). Abbreviations: PF, psychometric function; ICD, interchannel distance.
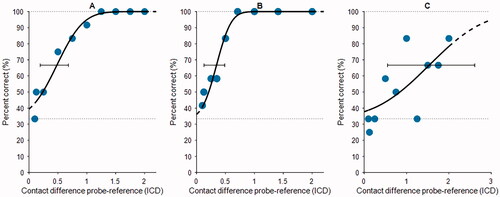
Figure 2. Overview showing per-participant discrimination scores (ordinate) for all tested electrode contacts (abcissa). The Dα scores from the full-array test are shown with black dots and lines, and the JNDα scores from the PFs are indicated by open circles, including the 95% credibility interval (whiskers). In the upper left corner of each box, the participant identification number and phoneme score with CI at 65 dB SPL in quiet are plotted. Abbreviations: PF, psychometric function; CI, cochlear implant.
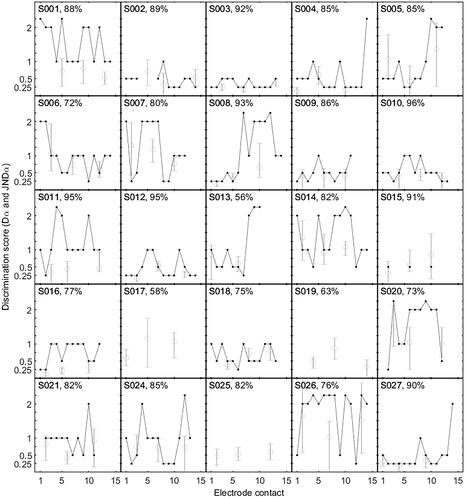
Figure 3. Individual JNDα scores (black dots) are grouped by four categories of corresponding Dα scores measured on the same electrode. Panels (A–D) show the summarised distribution in boxplots. The individual data points (black dots) are plotted with a horizontal offset for clarity. The box-and-whiskers denote interquartile ranges. The middle line shows the median, and crosses denote outliers. Panels (E–H) show JNDα scores with estimated uncertainty intervals (whiskers). The dotted line shows the Dα score for the group. Abbreviations: JND, just noticeable difference.
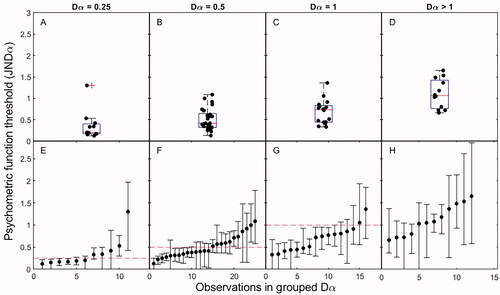
Figure 4. Participants’ choices were portioned out per quantised loudness roving factor (LRF). All trials of the three PFs are added together per participant. Participants are indicated on the abscissa and their relative choices on the ordinate. The top panel shows their choices for all correct answers. The middle panel shows choices for all wrong answers. The bottom panel shows choices for all wrong answers while the fit of the PF indicated >80% correct for that α value. For every participant, the bottom bin (blue) indicates the largest LRF (loudest stimulus) for the 3AFC trial, the middle (red) indicates the middle LRF (middle stimulus), and the top (yellow) indicates the lowest LRF (softest stimulus). The numbers at the top of the graph indicate the number of trials in this category.
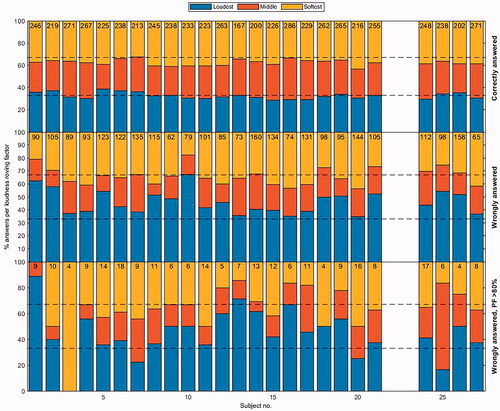
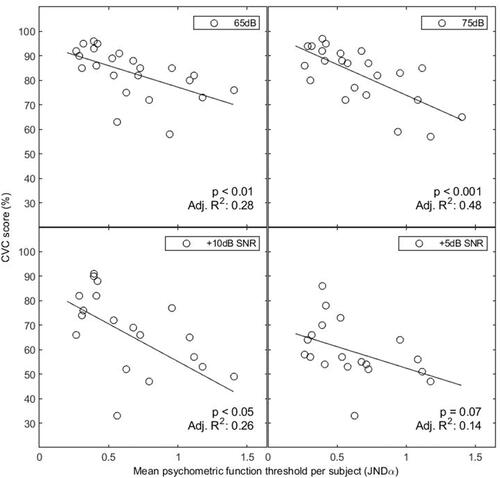
Figure 5. Correlation between participants’ mean PF threshold (abscissa) and phoneme score (ordinate) for all four listening conditions. Each dot represents a participant, and the line shows the linear fit. Abbreviations: CVC, consonant vowel consonant; JND, just noticeable difference.