
Figures & data
Table 1. Participant demographic information.
Figure 1. Graphical depiction of discrete emotions related to hearing loss and hearing aid(s) expressed by participants, on a valence/arousal scale (Bradley and Lang Citation1999). Valence: 1 = negative, 5 = neutral, 9 = positive. Arousal: 1 = low, 9 = high.
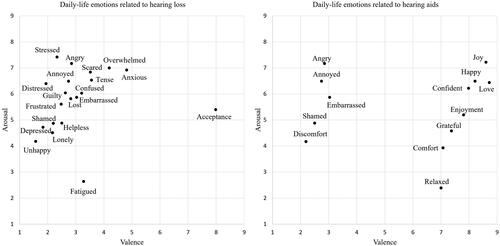
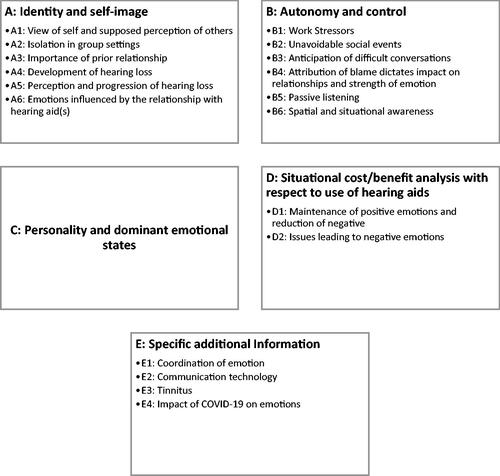
Figure 2. Thematic analysis results: Main themes and subthemes. See supplementary digital content 3 for the full results table, including a full description and a relevant quotation for each main theme and subtheme.
Supplemental material