
Figures & data
Figure 1. Hearing thresholds of both ears with and without earplugs of the 24 participants from Exp. 1 (left panel) and of the 12 participants from Exp. 2 (right panel). Filled circles show the average thresholds of both ears per frequency. Dotted lines show the minimum and maximum thresholds per frequency, solid lines the standard deviation per frequency.
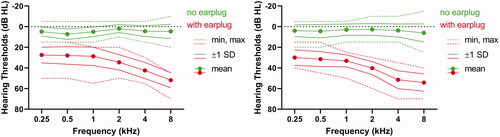
Figure 2. Violin plots of the antiphasic and diotic SRTs for 40 (green), 60 (orange) and 80 dB SPL (blue) overall presentation levels for no earplugs (left panel), a unilateral earplug (mid panel) and bilateral earplugs (right panel).
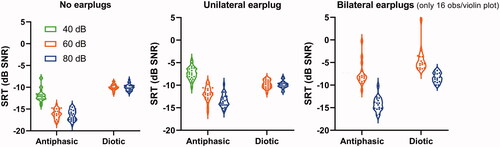
Figure 3. Scatter plots of the SRTs and the poorer ear PTA for the diotic SRT, antiphasic SRT and the BILD in function of the poorer ear PTA for presentation levels of 80 and 60 dB SPL (top and lower panels, respectively). The horizontal lines represent the SRT cut-off and the vertical lines distinguish normal hearing and hearing loss in the poorer ear.
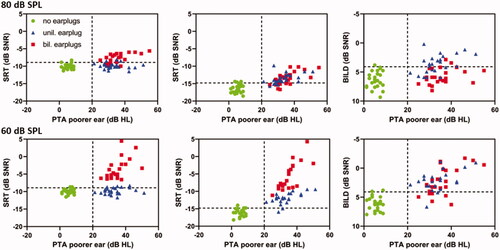
Table 1. Percentages and absolute numbers (n, number of participants out of 24) of correctly classified cases of the diotic and antiphasic DIN for unilateral and bilateral CHL at different presentation levels and the BILD.
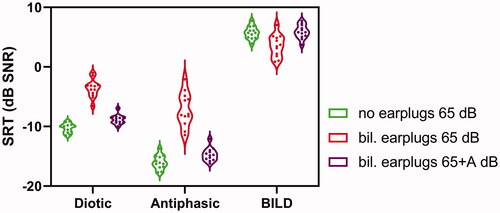
Figure 4. Violin plots of the diotic and antiphasic DIN SRTs and the BILD in the condition without earplugs at 65 dB SPL, with bilateral earplugs at 65 dB SPL and at 65 + A dB SPL (A = individual attenuation level).
Supplemental Material
Download MS Word (123 KB)Data availability statement
The data that support the findings of this study are available from the corresponding author, S. Polspoel, upon reasonable request.