
Figures & data
Figure 1. The number of positive responses per participant compared to those reported by Kentala et al. (Citation2008) and Beukes et al. (Citation2018b).
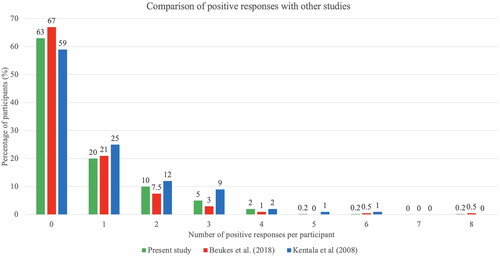
Table 1. Statistical analysis of demographic and clinical variables between those who reported at least one positive experience and those that did not.
Table 2. Positive responses to the open-ended questions.