
Figures & data
Table 1. Summary of multiple logistic regression for variables predicting the non-report of an acknowledged hearing difficulty to a doctor or nurse in primary care in the English Longitudinal Study of Ageing (ELSA) Wave 7.
Figure 1. The questions on hearing loss, hearing in noise, and hearing aid recommendation in the English Longitudinal Study of Ageing (ELSA) Wave 7 (n = 8529). aThe sum of those who rated their hearing as fair or poor on a 5-point Likert scale (with 1 indicating excellent; 2, very good; 3, good; 4, fair; and 5, poor) or responded that they have moderate or great difficulty in following a conversation if there is background noise (such as television, radio, or children playing). bTwo participants responded “I do not know” and were excluded from the analysis.
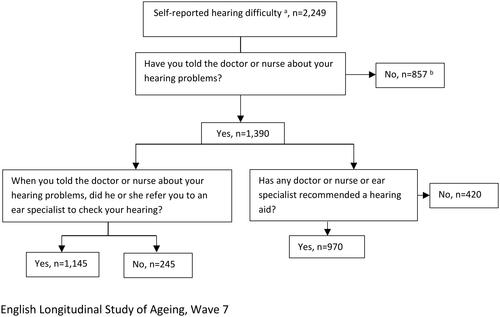
Figure 2. The questions on hearing aid uptake and use in the English Longitudinal Study of Ageing (ELSA) Wave 7 among those with self-reported hearing lossa (n = 2249). aThe sum of those who rated their hearing as fair or poor on a 5-point Likert scale (with 1 indicating excellent; 2, very good; 3, good; 4, fair; and 5, poor) or responded that they have moderate or great difficulty in following a conversation if there is background noise (such as television, radio, or children playing). bOne participant responded “I do not know” and was excluded from the analysis.
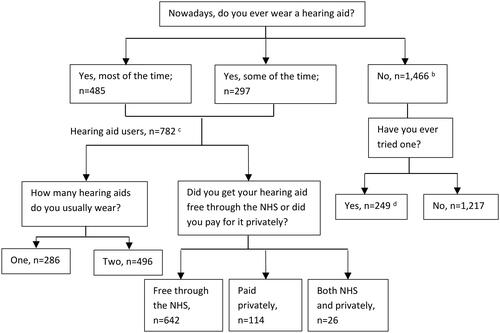
Figure 3. Behaviour on hearing aids use among 1145 participants who acknowledged hearing loss, disclosed it to a doctor or nurse in primary care, and were referred to an ear specialist to check their hearing (data from the English Longitudinal Study of Ageing (ELSA) Wave 7, a nationally representative cohort of 8529 older adults aged 50 years old and above in England).
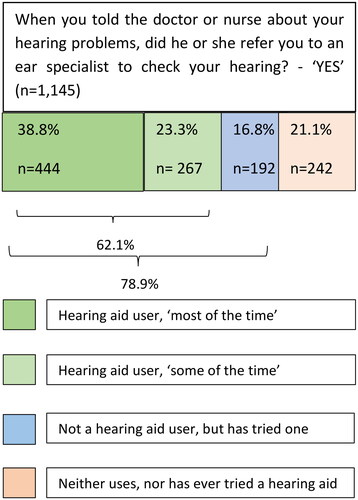
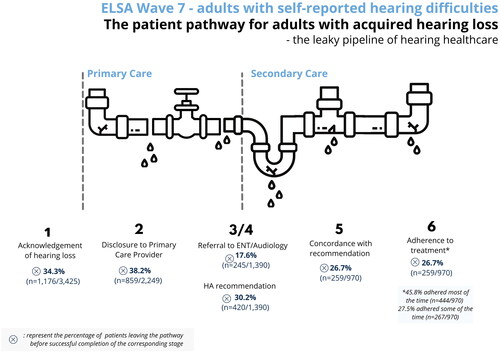
Figure 4. Proportions of participants in the English Longitudinal Study of Ageing (ELSA) Wave 7 with self-reported hearing lossa who leave the hearing pathway before the successful completion of the corresponding stage. aThe sum of those who rated their hearing as fair or poor on a 5-point Likert scale (with 1 indicating excellent; 2, very good; 3, good; 4, fair; and 5, poor) or responded that they have moderate or great difficulty in following a conversation if there is background noise (such as television, radio, or children playing).
Supplemental Material
Download PDF (163.5 KB)Data availability statement
The English Longitudinal Study of Ageing dataset is publicly available via the UK Data Service (http://www.ukdataservice.ac.uk). Statistical code is available from the corresponding author upon request at [email protected].