
Figures & data
Figure 1. Auditory brainstem response waveforms were obtained over the 10-week data collection period for a female participant born at 32 weeks gestation. There are two tracings for every timepoint, each reflecting the averaged waveform from 2000 post-stimulus EEG samples. Waveform morphology and latencies are representative of those seen for the “pre-term” participant group showing improved response definition and decreased response latency throughout the study. Responses were obtained to 500 Hz tone bursts (panel A) and 4000 Hz tone bursts (panel B) presented to the test ear at 70 dBnHL. The arrow markers represent the Wave V peak in the response complex.
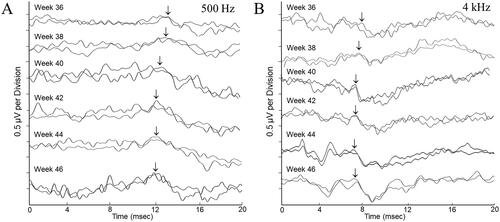
Figure 2. Mean ABR wave V latency values for pre-term and full-term groups show latency decreases over the recording period. Panel A shows findings for a 500 Hz tone-burst stimulus presented to the test ear at 70 dBnHL and panel B shows results for a 4000 Hz stimulus presented to the test ear at 70 dBnHL. “Timepoint” is GA in weeks. Error bars represent the mean ± 1 SD range.
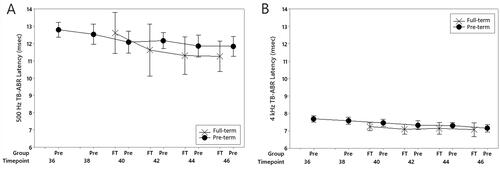
Table 1. Auditory brainstem response Wave V latency means, standard deviations, and standard deviation confidence intervals for each subject group at each data collection point.
Figure 3. Mean ABR threshold values for pre-term and full-term groups show minimum response level decreases across the recording period. Panel A shows findings for a 500 Hz tone-burst stimulus and panel B shows results for a 4000 Hz stimulus. “Timepoint” is GA in weeks. Error bars represent the mean ± 1 SD range.
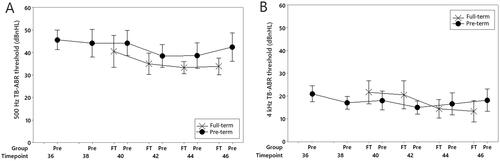
Table 2. Auditory brainstem response threshold means, standard deviations and standard deviation confidence intervals for each subject group at each data collection point.