
Figures & data
Figure 1. The unaided hearing thresholds of the individual participants for the non-implanted ear. The dashed red line displays the group mean threshold. For calculating the average, in case of “no response,” the reading was given a value of 130 dB HL based on (BSA (British Society of Audiology) Citation2018).
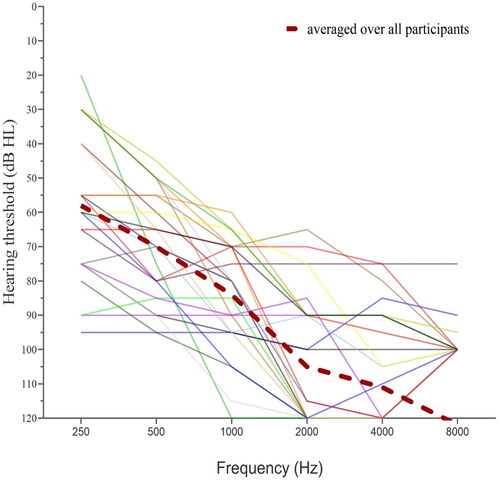
Figure 2. The AB-York Crescent of Sound at the University of Southampton Auditory Implant Service.
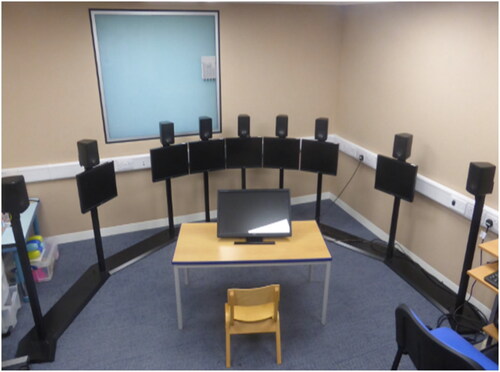
Table 1. Summary of the main procedures and the listening conditions for CI participants using the Naida Link HA.
Figure 3. Box plots representing the SRTs in dB SNR for the three listening conditions: (1) Cl only, (2) CI + Naida Link HA + binaural streaming technology OFF, and (3) CI + Naida Link HA + binaural streaming technology ON in SrN ± 60° (left), S0°N ± 60° (middle), and SHANCI (right) tests. The boxes represent the two middle quartiles. The solid horizontal lines within each box indicate the median; the cross inside the box shows the mean. The outliers are plotted as solid circles. Lower SRTs indicate better performance could add. N = 26.
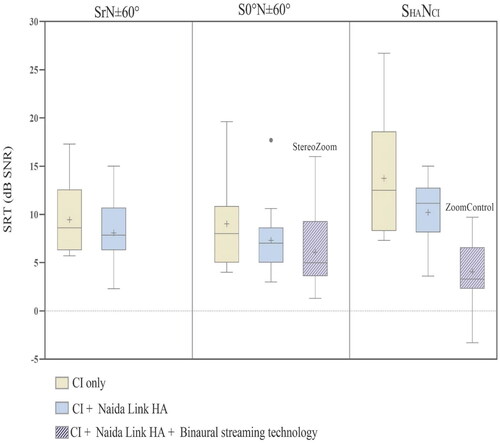
Table 2. Mean difference (95% confidence intervals) between the listening conditions for the SrN ± 60°, S0°N ± 60° and SHANCI tests.
Figure 4. Results of the localisation (left-hand panel) and tracking test (right-hand panel) for the adult CI participants in the listening condition of using the CI only (yellow box plots) and in the listening condition of CI + Naida Link HA (blue box plots). The boxes represent the two middle quartiles. The solid horizontal lines within each box indicate the median; the cross inside the box shows the mean. The dashed horizontal line shows the level of performance expected by chance, with the grey shaded area showing the 5th and 95th percentiles of the chance range. The outliers are plotted as solid circles. N = 26.
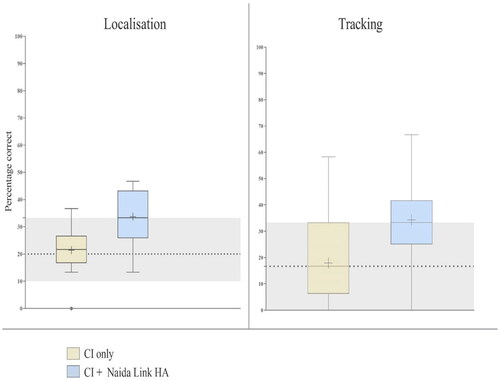
Figure 5. Scores on the overall SSQ and each of the three subscales: speech, spatial and qualities of the listening conditions: (1) the CI alone (yellow box plots), (2) CI + previous standard HA (grey box plots), and (3) CI + Naida Link HA (blue box plots). The boxes represent the two middle quartiles. The solid horizontal lines within each box indicate the median; the cross inside the box shows the mean. The outliers are plotted as solid circles. N = 20.
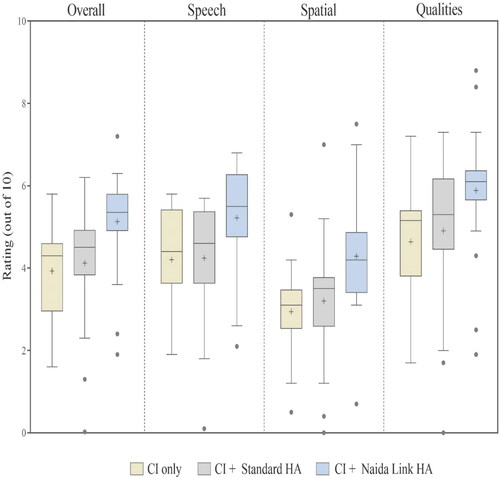
Table 3. Results of correlation analyses, r values (95% confidence interval), between the unaided thresholds of non-implanted and the performances scores when using the CI with the Naida Link HA (*n = 24).