
Figures & data
Figure 1. Schematic overview of the hearing range of subjects with hearing loss compared to subjects with normal hearing and the maximum output (MO). The covered dynamic range reflects the part of the dynamic range accessible to the patient by using an implant. The dynamic range is determined as the difference between MO of the implant system and the hearing threshold of the patient.
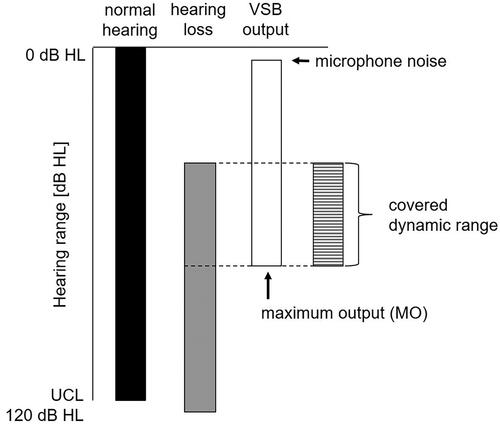
Table 1. Band importance function as reported in ANSI S3 5-1997/Table 4 and rescaled for four (4F) and five frequencies (5F), respectively. Please note that the band importance function for 8 kHz was applied to 6 kHz instead.
Figure 2. Scatterplot of word recognition scores (WRS, empty circles) as a function of dynamic range (A DR PTA4; B DR PTA8) and weighted dynamic range (C WDR PTA4; D WDR PTA5). The boxplot for each 10-dB dynamic range group shows the median (solid line), the 25th and 75th percentiles (box) and the 10th and 90th percentile (whiskers) the mean value (dashed line) and outliers (black circles). Significant differences between adjacent 10-dB dynamic range groups are marked by an asterisks (*p < 0.05; ** p < 0.01). The sigmoidal function was fitted based on the single data points using the Chapman equation with three parameters.
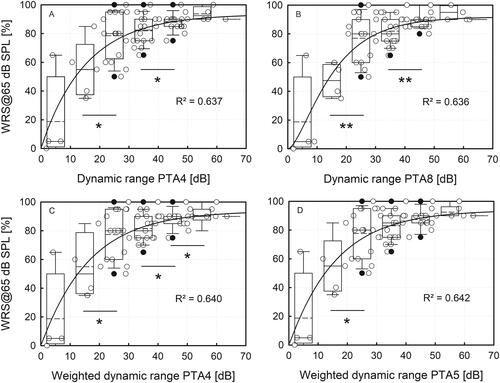
Table 2. Descriptive statistics of word recognition score (WRS) for each 10-dB dynamic range group 1 to 7 presenting the mean values, standard deviation (SD), the median and the 25th and 75th percentile and the sample size of each group for all four dynamic range variables.
Table 3. Statistic results of the pairwise testing of word recognition scores (WRS) of neighbouring dynamic range groups 1 to 6 only for all dynamic range variables (DRPTA4, DRPTA8, WDRPTA4, WDRPTA5). Group 7 was not included in the pairwise testing because the sample size was too small.
Figure 3. Comparison of different measures characterising the DR, weighting the importance of different sets of frequencies equally or according to their importance for speech cues (SII): (A) DR PTA4 vs. DR PTA8); (B) DR PTA4 vs. WDR PTA4; (C) DR PTA4 vs. WDR PTA5; (D) WDR PTA4 vs. WDR PTA5.
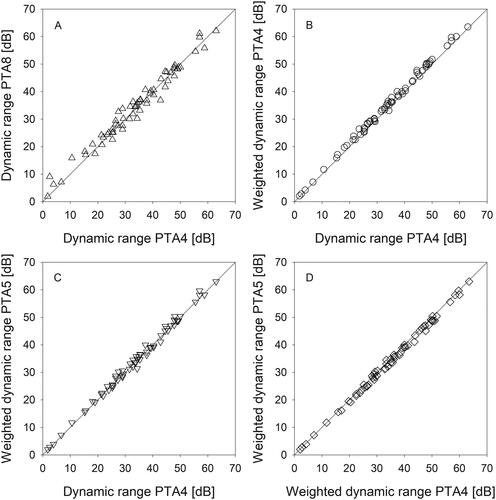
Table 4. Comparison of different dynamic range approaches used for determining the relationship between the dynamic range of an implanted patient and their ability for word recognition (n = 66).
Table 5. Results of the nonlinear regression model with dynamic fitting based on the sigmoidal Chapman function with unknown parameters a, b and c and the overall model fit.
Data availability statement
The clinical data that support the findings of this study are available from the corresponding author, SB, upon reasonable request. The technical data that support the findings of this study are available in the accompanying manuscript from the co-author, H.M., entitled “An easy method to determine crucial AMEI performance parameters from clinical routine data in individuals – Part 1: maximum output”.