
Figures & data
Figure 1. Cumulative frequency of children whose hearing loss was detected through each mode or referral across the age of referral to the audiology clinic, rounded to the nearest half-year. SLP: speech-language pathologist; ENT: ear, nose and throat physician.
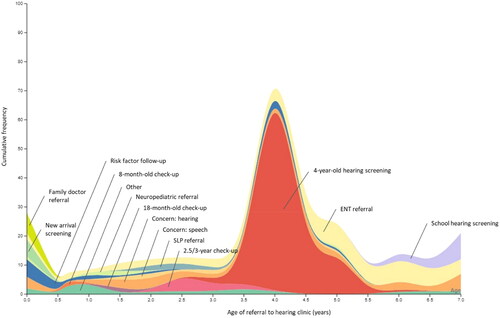
Table 1. The number and percentage of children with various risk factors for late-onset hearing loss who were referred to the audiology clinic by various modes.
Figure 2. Box plots showing the quadrants, medians, means (X), and range for the age and time delays (in months) from detection to intervention for children with hearing loss, with and without additional disabilities, whose hearing loss was detected after newborn hearing screening. Single points show the skewed distribution and wide variability in time delays from referral to intervention. *Significant difference at p < 0.01.
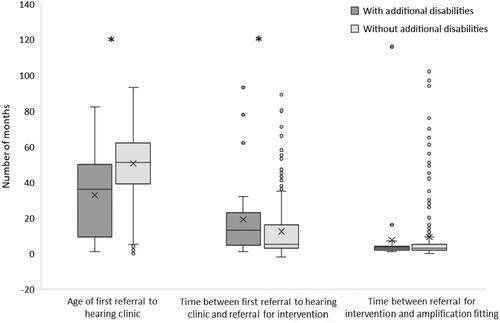
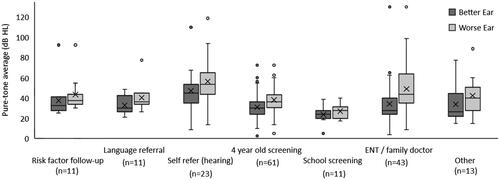
Figure 3. Box plots showing the quadrants, medians (−), means (X), and range (single points denote outliers) for the pure-tone average for the better and worse ear for children with bilateral hearing loss across the main mode of referral by which hearing loss was detected.
Data availability statement
The participants of this study did not give written consent for their data to be shared publicly, so due to the sensitive nature of the research supporting data is not available.