
Figures & data
Figure 1. The Stimuli used in each group.
The numbers denote the stimuli classes, and the letters denote class members. N-ABS = node as abstract stimuli group, N-PIC = node as picture stimuli group, ABS= all abstract stimuli group.
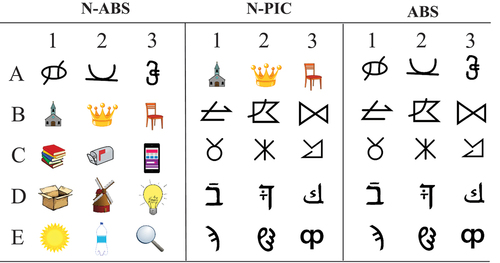
Figure 2. A visual display of trials as it appears on the computer screene.
Panel (a) shows an example of baseline trials for N-ABS and symmetry trials for N-PIC. Panel (b) shows an example of baseline trials in N-PIC and symmetry trials in N-ABS, and Panel (c) shows an example of all trials in ABS and equivalence trials in N-PIC.
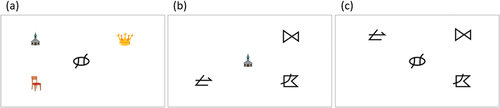
Table 1. Overview of the training and test phases.
short-legendFigure 3.
The graph shows the averaged mean fixation duration to sample stimulus at the beginning and the end of the training, and the first five and the last five test trials of each relation tested. The asterisk represents a statistically significant one-way ANOVA test. BSL=baseline relations, SYM=symmetry, EQ=equivalence, N-ABS = node as abstract stimuli group, N-PIC = node as picture stimuli group, ABS= all abstract stimuli group. Error bars represent the standard error of the mean (SEM). ms=milliseconds.
short-legendFigure 4.
The graph shows the averaged mean fixation duration to correct comparison stimuli at the beginning and the end of the training and the first five and the last five test trials of each relation tested. The asterisk denotes statistically significant post hoc Tukey tests. BSL=baseline relations, SYM=symmetry, EQ=equivalence, N-ABS = node as abstract stimuli group, N-PIC = node as picture stimuli group, ABS= all abstract stimuli group. Error bars represent the standard error of the mean (SEM). ms=milliseconds.
short-legendFigure 5.
The graph shows the averaged mean fixation duration to incorrect comparison stimuli at the beginning and the end of the training, and the first five and the last five test trials of each relation tested. The asterisk denotes statistically significant post hoc Tukey tests. BSL=baseline relations, SYM=symmetry, EQ=equivalence, N-ABS = node as abstract stimuli group, N-PIC = node as picture stimuli group, ABS= all abstract stimuli group. Error bars represent the standard error of the mean (SEM). ms=milliseconds.
short-legendFigure 6.
The graph shows the average mean number of gaze transitions between stimuli at the beginning and end of the training and the first five and the last five test trials of each relation tested. The asterisk denotes statistically significant post hoc Tukey tests. BSL=baseline relations, SYM=symmetry, EQ=equivalence, N-ABS = node as abstract stimuli group, N-PIC = node as picture stimuli group, ABS= all abstract stimuli group. Error bars represent the standard error of the mean (SEM).
short-legendFigure 7.

The graph shows the mean percentage of trials with refixation to sample stimulus at the beginning and the end of the training, and the first five and the last five test trials of each relation tested. The asterisk denotes statistically significant post hoc Tukey tests. BSL=baseline relations, SYM=symmetry, EQ=equivalence, N-ABS = node as abstract stimuli group, N-PIC = node as picture stimuli group, ABS= all abstract stimuli group. Error bars represent the standard error of the mean (SEM).
Table 2. Results from the statistical tests.