Figures & data
Figure 1. Cost of living index in Norway and other European countries (Numbeo.com, Citation2018). Data source: Numbeo.com.
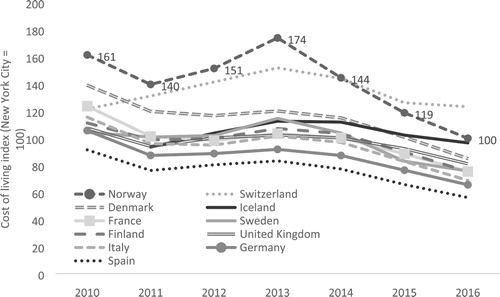
Figure 2. Correlation between the Norwegian GDP and the world crude oil price. Data source: The World Bank and the U.S. Energy Information Administration.
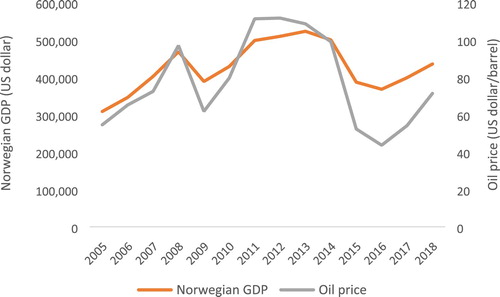
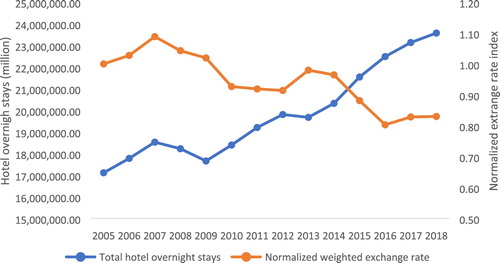
Figure 3. Development in number of tourists’ hotel guest nights relative to changes in value of NOK currency. Data source: Statistics Norway and The World Bank.