Figures & data
Table 1. Working definition of the stages of destination life cycle.
Table 2. Tourist overnight stays in Nordic countries and territories.
Figure 1. Current intensity (in 2018) and dynamics (2008–2018) of tourism arrivals in regions of Nordic countries.
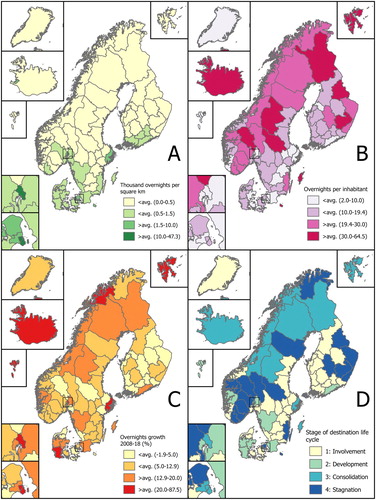
Table 3. Active Airbnb listings in Nordic countries and territories.
Figure 2. Airbnb offer in NUTS-3 regions of Nordic countries.
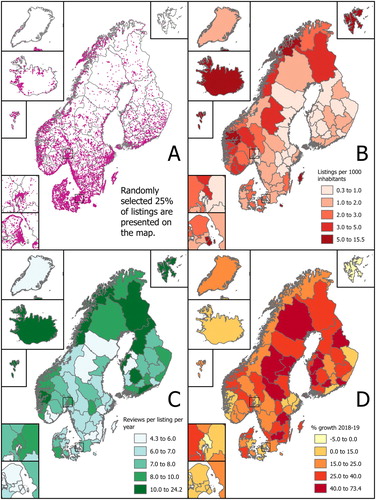
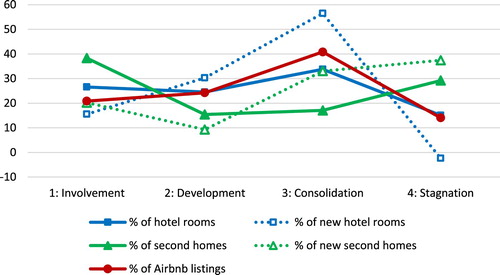
Figure 3. Distribution of new tourism accommodation capacity across regions in different stages of destination life cycle.