
Figures & data
Figure 1. The conceptual model of the study.
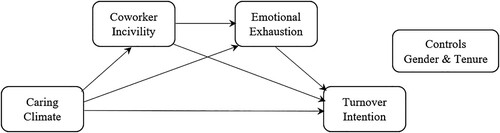
Table 1. Demographic profile of the respondents (n = 291).
Table 2. The confirmatory factor analysis results.
Table 3. Mean, standard deviations, correlations, and collinearity statistics of the study variables (n = 291).
Figure 2. Mediating effect model.
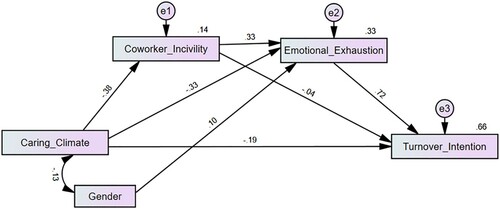
Table 4. Structural equation modeling (SEM) results for the serial multiple mediation model.