Figures & data
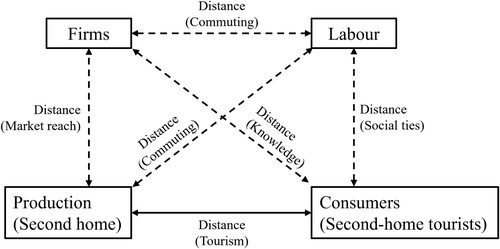
Figure 1. Conceptual illustration of spatially projected construction demand through second-home tourism.
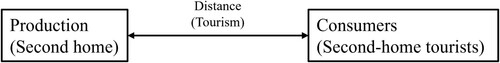
Table 1. Number of firms in the construction sector (SNI codes used in this study) as well as the whole economy, grouped by number of employees. Based on data from Statistics Sweden (Citation2023).
Figure 2. Plotted estimates of the main independent variables from the linear probability models (OLS) on the number of construction workers in the municipalities. Each colour corresponds to a model (Model 1, Model 2 and Model 3), and the line through the dot represents the size of standard errors.
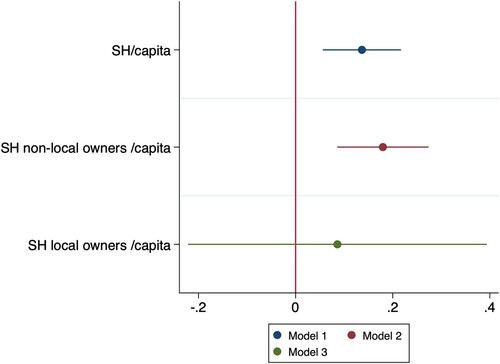
Figure 3. Net flow of tax-deductible investments per capita, in SEK, connected to second homes. Based on data from the Swedish Tax Agency (Citation2021).
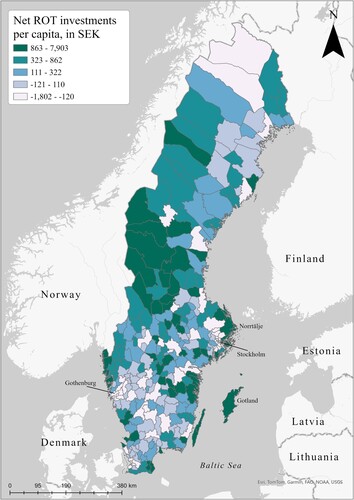
Figure 4. Conceptual illustration of spatially projected construction demand through second-home tourism, with the added dimension of firm mobility.
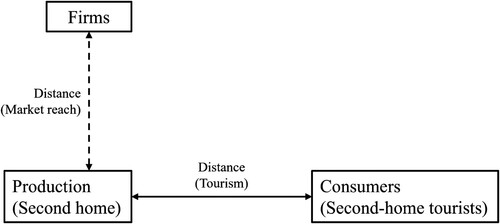
Figure 5. Conceptual illustration of spatial relationships between the actors studied in this paper, inviting to possible further research.