
Figures & data
Table 1. Research Sample – 29 April 2000 to 28 April 2017.
Figure 1. Domain causality – Calvert.
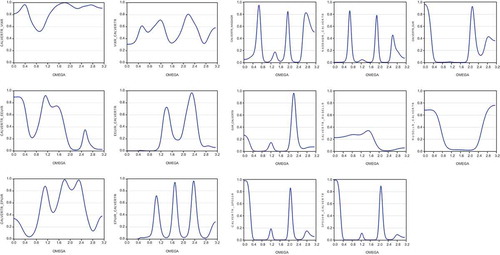
Figure 2. Domain Causality – DJSI.
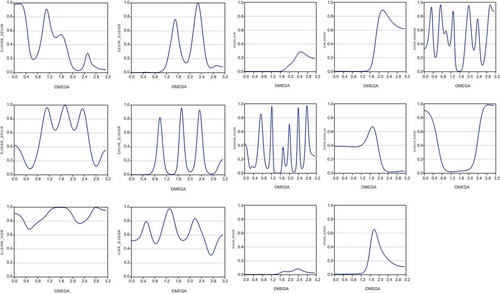
Figure 3. Domain Causality – DJSI2.
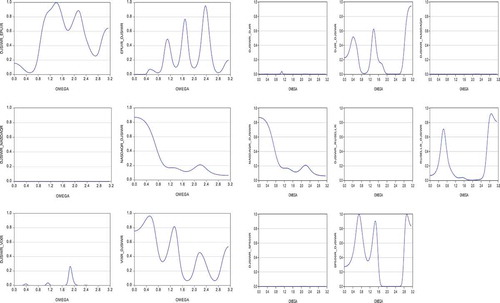
Figure 4. Domain Causality – MSCI.
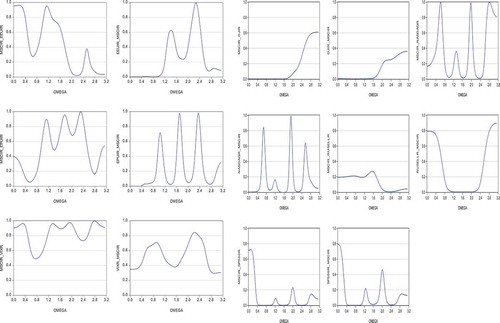
Figure 5. Domain Causality – DJS.
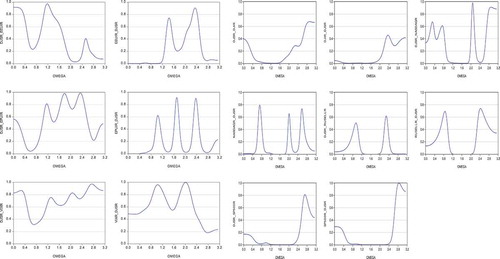
Figure 6. Realised Volatility.
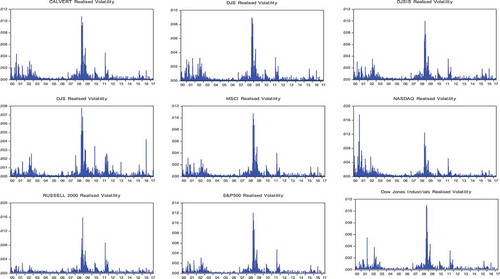
Table A1. Descriptive Statistics of Daily Returns.
Table A2. Correlation matrix.
Table A3. Market model 1.
Table A4. EEUi market model (Equation 4).
Table A5. EPUi market model (Equation 2).
Table A6. VIX market model (Equation 3).
Table A7. Cointegration tests (Causality domain model).