Figures & data
Figure 1. Distribution by sector (in %).
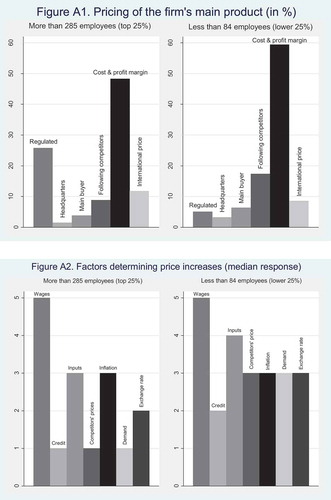
Figure 2. (a) Pricing of the firm’s main product (in %). (b)Pricing of firm’s main product by sector (in %). (c) Price setting in the manufacturing industry by subsector (in %).
Figure 3. Frequency of price adjustment (in %).
Figure 4. Are price changes concentrated in a particular month?
Figure 5. Price changes by month (in %).
Figure 6. Factors determining price increases (median response).

Table 1. Cost structure by CIIU classification (in %).
Figure 7. Temporal orientation of firms in the price setting process.
Figure 8. (a) Aggregated temporal orientation by variable. (b) Temporal orientation of firms in the price setting process by sector.
Figure 9. (a) Relative temporal orientation of firms in the price setting process by sector. (b) Temporal orientation of firms in the manufacturing sector by variable.
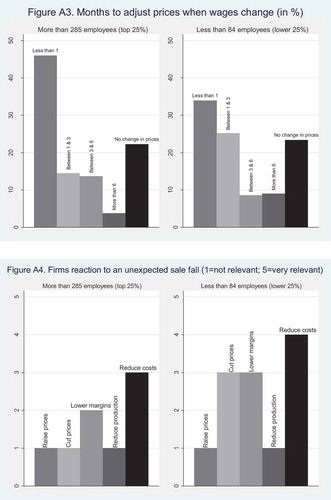
Figure 10. Months to adjust prices when wages change (in %).
Figure 11. Firms reaction to an unexpected sales fall1.
Table 2. Firms reaction to unexpected shocks.