
Figures & data
Table 1. Crisis dates.
Figure 1. Posterior mean of latent banking crisis indicator with end-of sample forecasts and 68 percent probability interval.
Figure 3. Forecast error variance decomposition by sector for each country.
Figure 4. Out-of-sample forecasts: ROC curves.
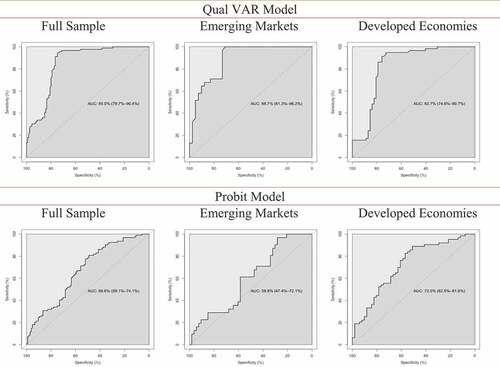
Figure 2. Posterior mean of latent banking crisis indicator with end-of sample forecasts and 68 percent (95 percent where specified) probability interval: Robustness check.
Table 2. Out-of-sample forecasts of banking crisis probabilities.
Table 3. In-sample probit forecasts.
Table 4. Out-of-sample Qual VAR forecasts.
Table 5. Out-of-sample probit forecasts.
Table 6. Out-of-sample forecasts: AUROC results.
Table A1. Variables and transformations.
Table A2. Unit-root tests.
Table A3. Out-of-sample prediction dates.
Table A4. Out-of-sample forecasts of banking crisis probabilities: robustness check.
Table A5. Probit model results.