
Figures & data
Table 1. Contingency table of fisher’s exact test for VaR measures in different periods
Table 2. Stock exchanges and the respective indices used
Table 3. GSADF tests for the log price–dividend ratio and log dividend difference in the nine markets
Table 4. Bubble periods obtained by the PSY test and the modified date-stamping method
Figure 1. Bubble identification results for the hong kong stock market.
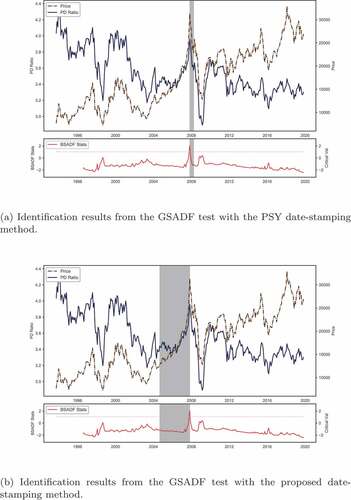
Table 5. Full, pre-bubble, bubble, post-burst, and normal periods for the bubbles examined in the nine stock markets
Table 6. Backtest results of riskmetrics VaR in the pre-bubble, bubble, and post-burst periods
Table 7. Backtest results of riskmetrics VaR in the normal and full periods
Table 8. Backtest Results of RiskMetrics 2006 VaR in the Pre-bubble, Bubble, and Post-burst Periods
Table 9. Backtest results of riskmetrics 2006 VaR in the full and normal periods
Table 10. Fisher exact test for the significance level of the difference of VaR failure rate by time period