
Figures & data
Table 1. Descriptive statistics
Table 2. Summary statistics of insurance policies
Table 3. Determinants of total premiums
Figure 1. Percentage of respondents who have experience of hospitalization
Table 4. Hospitalization expenses and number of hospital days
Table 5. Estimated relative risk aversion coefficients by income and insurance options (a) Fixed hospitalization probability (b) Variable hospitalization probability
Figure 2. for each insurance option by age.
Table 6. Basic statistics for
Figure 3. Kernel density plot of .Note: Probability of hospitalization is fixed across age groups for (a) and variable for (b).
Table 7. Consistency between for hospitalization benefits and additional riders
Figure 4. Response to the general question about risk aversion.
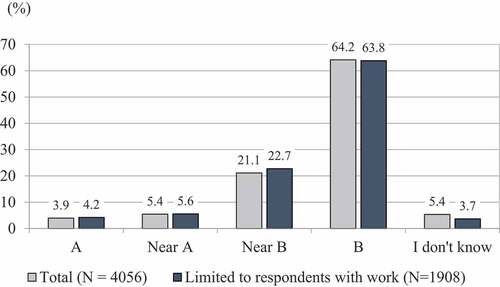
Table 8. Consistency between for hospitalization benefits and general risk aversion