
Figures & data
Figure 1. Location of current CO2 EOR projects and pipeline infrastructure in the U.S.
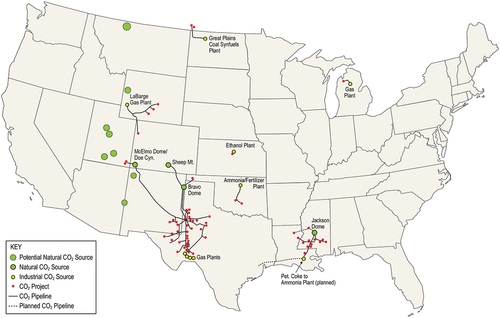
Figure 2. Oil fields in Utah.
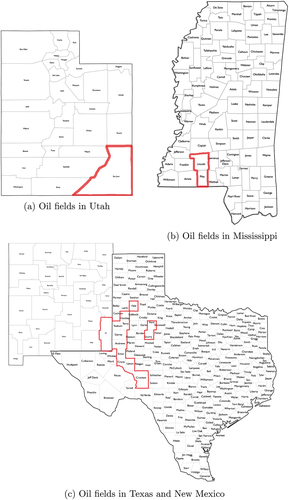
Table 1. Summary of number of contracts and total quantity from each supplier
Table 2. Summary of number of contracts and total quantity from suppliers in the Permian Basin
Figure 3. Oil fields in Mississippi.
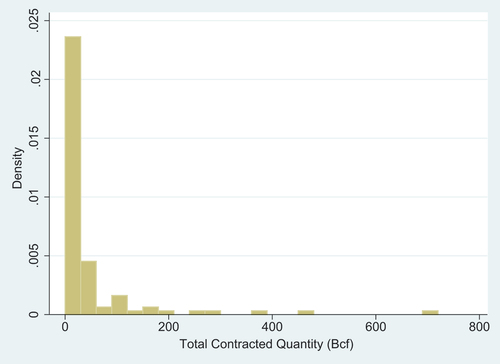
Figure 4. Oil fields in Texas and New Mexico.
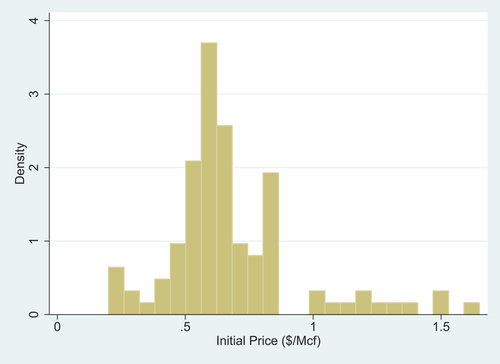
Figure 5. Location of the oil fields from the CO2 sales contracts.
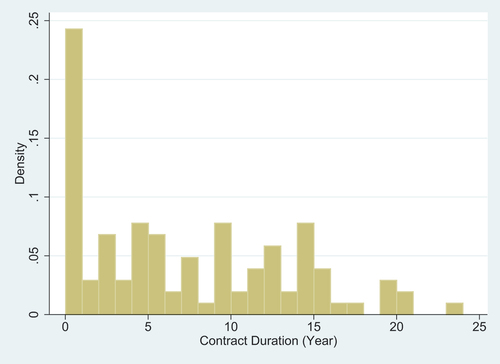
Table 3. Summary of contract duration, total contracted quantity and initial CO2 price
Table 4. Summary of different contract types in terms of duration
Figure 6. Different contracts by duration and indexing.
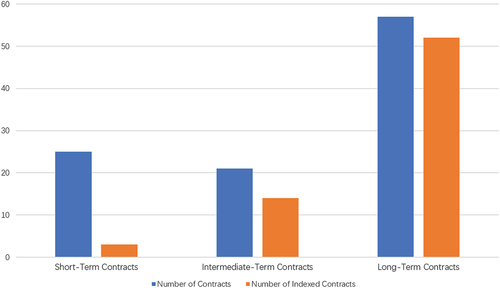
Table 5. Summary of indexes used in contracts
Table 6. Probit regression of the contract type ()
Table 7. Summary of the price-pegging contracts
Table 8. OLS regression of the pegging coefficient, against different initial oil prices
Table 9. OLS regression of the pegging coefficient, against different annual oil price volatility