Figures & data
Table 1. Descriptive statistic for ,
observations.
Figure 1. (a.1-c.1) The volatility of daily bitcoin return (daily ) and
, (d.1-f.1) The volatility of monthly
and
, respectively. (a.2-f.2) The wavelet power spectrum of daily and monthly
,
respectively. The white line refers to the COI. The color code of power varies from blue (low power) to yellow (high power).
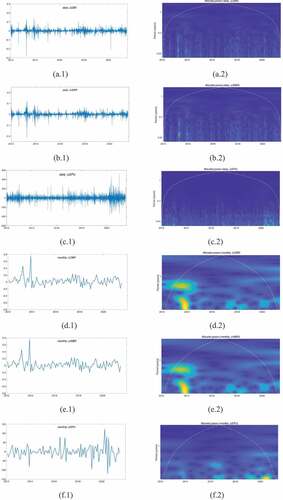
Figure 2. Wavelet coherency of daily CBR- (a), WBR-
(b), and monthly CBR-
(c), WBR-
(d) respectively. The arrows contour denotes the 5% significance level. The color code of power varies from blue (low power) to yellow (high power).
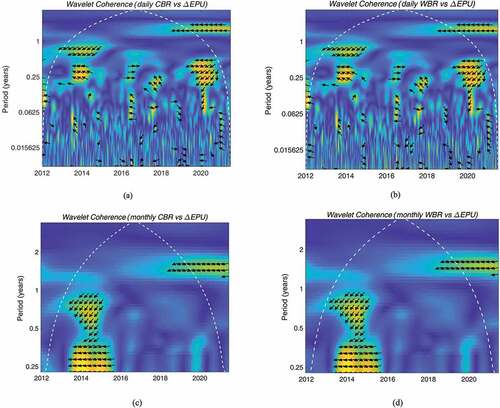
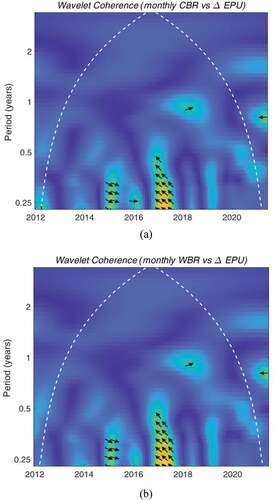
Figure 3. Wavelet coherency of monthly CBR-USA (a), WBR-USA
(b), respectively. The arrows contour denotes the 5% significance level. The color code of power varies from blue (low power) to yellow (high power).
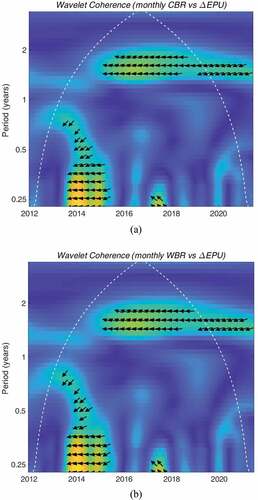
Figure 4. Wavelet coherency of monthly CBR-China (a), WBR-USA
(b), respectively. The arrows contour denotes the 5% significance level. The color code of power varies from blue (low power) to yellow (high power).