Figures & data
Table 1. Data sources.
Table 2. Summary statistics.
Figure 1. Non-performing loan ratios.
Note: The data sample spans from 2006Q1 to 2017Q3. The displayed NPL ratios are based on data sourced from the IMF FSI, Banque de France, Banco de España, Central Bank of Cyprus and Bankscope.
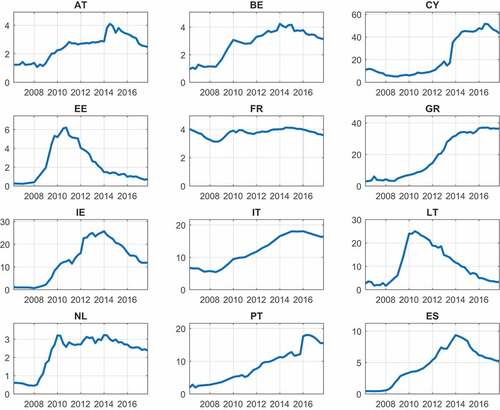
Table 3. Correlation matrix among the variables included in the panel VAR.
Figure 2a. Response to a shock to the change in the NPL ratio with new ordering.
Note: The Figure reports the responses of selected endogenous variables to one standard deviation shock to the change in NPL ratios. Real GDP growth, headline inflation, residential real estate prices and corporate and mortgage loans are expressed in annual growth rates. The Euribor, bank lending spreads, the change in NPL ratios and the capital and reserves-to-asset ratio are expressed in percentage points. Responses are reported for 4 years (16 quarters) after the shock (assumed to take place at time 0). The median of the accepted draws is plotted together with the 16% and 84% Bayesian credibility bands.
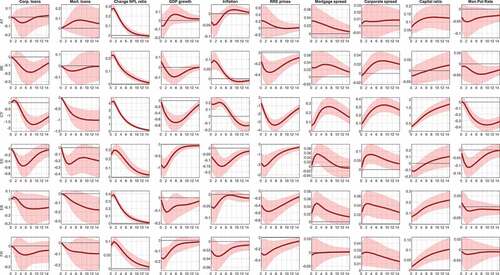
Figure 2b. Continued.
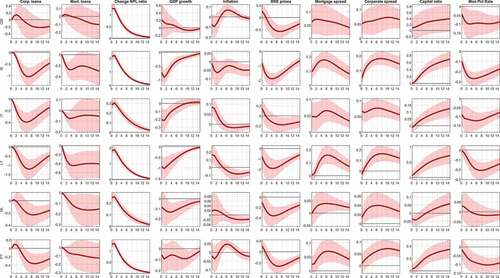
Table 4. Forecast error variance decomposition (shock to the change in the NPL ratio).
Figure 3. Response to a shock to the annual rate of change in NPL volumes.
Note: The Figure reports the responses of selected endogenous variables to one standard deviation shock to the annual rate of change in NPL volumes. Real GDP growth, headline inflation, residential real estate prices and corporate and mortgage loans are expressed in annual growth rates. The Euribor, bank lending spreads, the change in NPL ratios and the capital and reserves-to-asset ratio are expressed in percentage points. Responses are reported for 4 years (16 quarters) after the shock (assumed to take place at time 0). The median of the accepted draws is plotted together with the 16% and 84% Bayesian credibility bands.
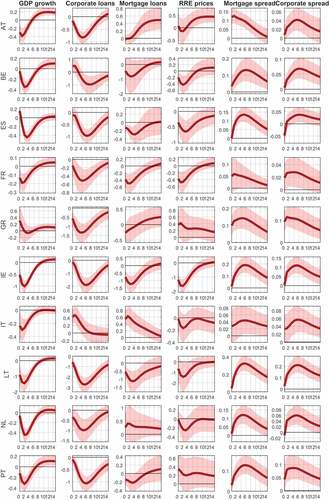
Figure 4. Observed and assumed out-of-sample baseline and adverse change in NPL ratios for the structural scenario analysis.
Note: The data sample spans from 2006Q1 to 2017Q3. The out-of-sample assumptions for the baseline and adverse paths for the change in NPL ratios span from 2017Q4 to 2020Q3. The data are sourced from the IMF FSI, Banque de France, Banco de España, Central Bank of Cyprus and Bankscope.
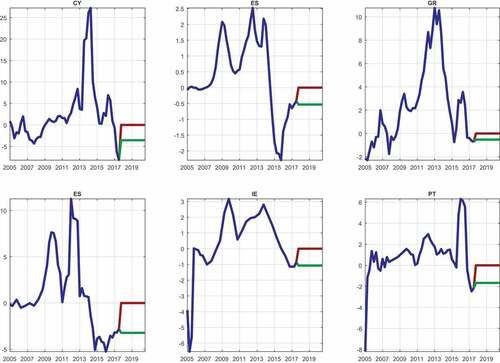
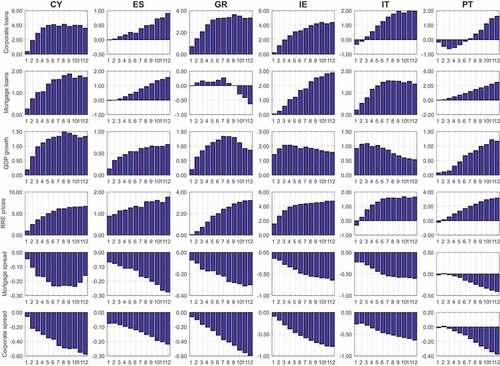
Figure 5. Difference in the structural scenario forecasts between the baseline and the adverse path for the main variables included in the panel VAR.
Note: The figure reports the difference between the baseline and the adverse structural scenario forecasts of the main variables in the panel VAR. Under both the baseline, the adverse assumption, the forecasts for the variables in the VAR are computed assuming that only the structural shock to the change in NPL ratios adjusts to ensure the conditioning path for this variable. Real GDP growth, headline inflation, residential real estate prices and corporate and mortgage loans are expressed in annual growth rates. The Euribor, bank lending spreads, the change in NPL ratios and the capital and reserves-to-asset ratio are expressed in percentage points.