
Figures & data
Table 1. Summary statistics.
Figure 1. Correlations between monetary policy index and trade credit for firm groups with different CSR levels.
Note: This figure shows the relationship between monetary policy index and the mean value of the trade credit to total assets ratio (%) for two firm groups with different CSR levels. Firm-fixed effects are excluded from the trade credit to total asset ratio and CSR. ) presents the relationship for firms with CSR in a given period above the median in that period. ) presents the relationship for firms with CSR in a given period below the median in that period.
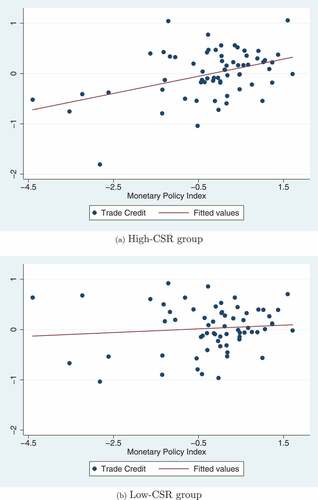
Table 2. Main results.
Table 3. Robustness check: control industry-specific time-fixed effects.
Table 4. Robustness check: control other relevant firm characteristics.
Table 5. Robustness check: use instrumental variable estimation.
Table 6. Extended analysis: regional social trust.
Table 7. Extended analysis: market competitiveness.
Supplemental material