
Figures & data
Figure 1. Real GDP per capita: Spain and several European countries, 1850–2018.
(2011 US$, 2011 benchmark)Source: Maddison Project Database, version 2020 (Bolt and van Zanden, Citation2020).
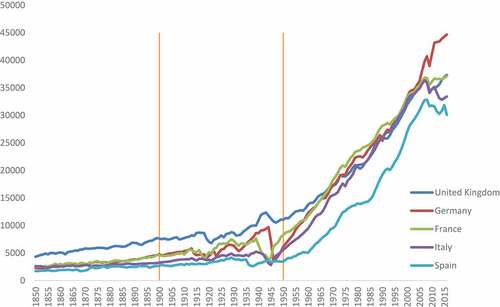
Figure 2. Evolution of Spanish exports, 1850–2020.
(million €, 2010 prices) Source: Prados de la Escosura (Citation2017).
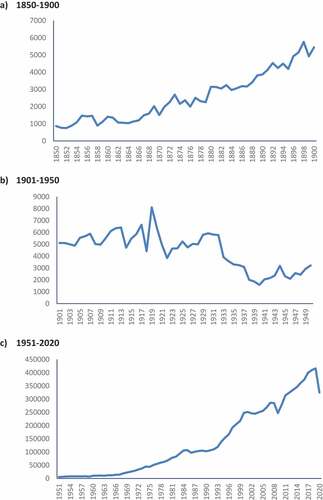
Table 1. Cumulative growth rates of GDP and exports: Spain, 1850–2020(percentage points).
Table 2. Ng-Perron tests for unit roots.
Table 3. Estimation of growth equations, 1850–2020(dependent variable: ).
Table 4. Contributions to economic growth, 1850–2020(percentage points).
Table 5. Bai-Perron tests for structural change.
Table 6. Estimation of growth equations, 1850–1895 and 1896–2020(dependent variable: ).
Table 7. Contributions to economic growth, 1850–1895 and 1896–2020(percentage points).
Figure 3. Recursive estimates of the coefficients on the effect of exports.
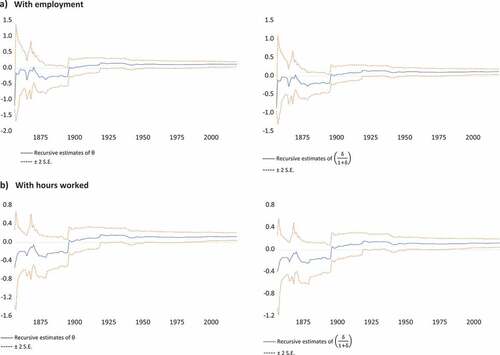
Table 8. Granger-causality tests.