
Figures & data
Table 1. Evaluation index system of digital economy development level.
Table 2. Results of descriptive statistics of variables.
Figure 1. 2015 Spatial Development Patterns of China’s Digital Economy, Green Innovation Efficiency and Industrial Clustering.
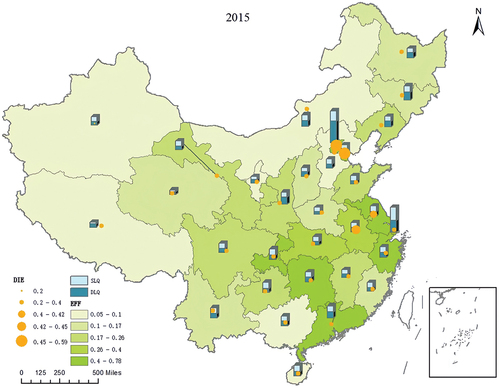
Figure 2. 2020 Spatial Development Patterns of China’s Digital Economy, Green Innovation Efficiency and Industrial Clustering.
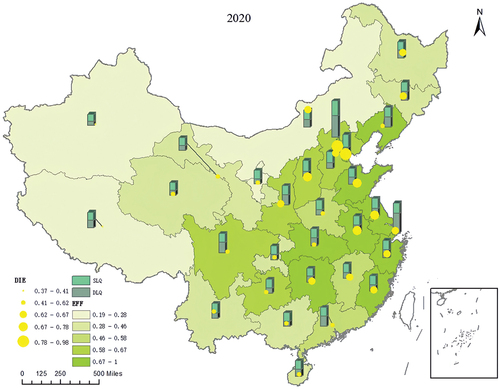
Table 3. Basic regression empirical results.
Table 4. Introduction of cross term empirical results.
