
Figures & data
Table 1. List of variables and data sources.
Figure 1. Relationship between corruption and revenue in 1996 and 2020.
The fitted values (red line) are based on a bivariate linear regression. Countries with revenue-to-GDP ratios greater than one are excluded.
Source: Authors’ analysis.
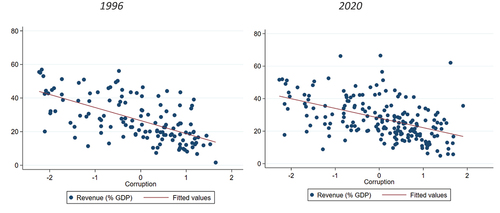
Figure 2. Revenues in high/low corruption countries over time.
High corruption countries are defined as those with a negative value of the “Control of Corruption” indicator from the Worldwide Governance Indicators (WGI) database (all others are considered low corruption countries).
Source: Authors’ analysis.
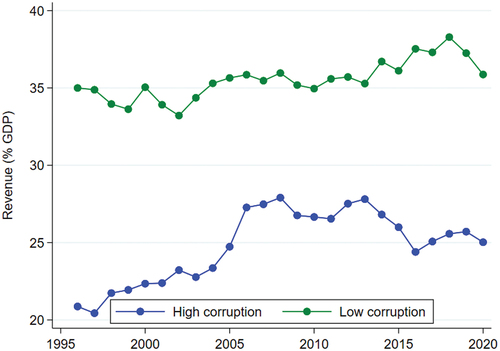
Figure 3. Relationship between corruption and revenue in different country groups, 2020.
Income groups are defined according to World Bank classification. Democratic countries are defined as those with a Polity score above 5 (all others are considered non-democratic). Resource-poor countries are defined as those with total natural resources rents below 5 percent of GDP (all others are considered resource-rich). The fitted values (red lines) are based on bivariate linear regressions. Countries with revenue-to-GDP ratios greater than one are excluded. Data are for the year 2020.
Source: Authors’ analysis.
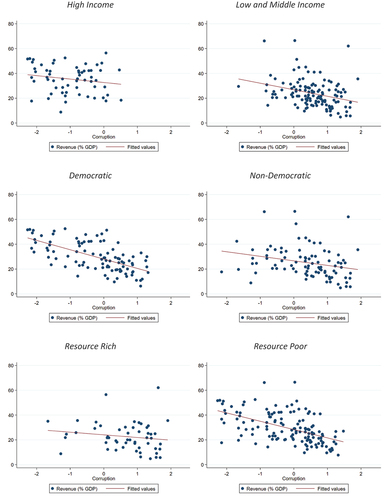
Table 2. Regression results—dependent variable: revenue (% GDP).
Table 3. Results for high/low and middle-income countries—dependent variable: revenue (% GDP).
Table 4. Results for democratic/Non-democratic countries—dependent variable: revenue (% GDP).
Table 5. Results for resource-rich/Resource-poor countries—dependent variable: revenue (% GDP).