
Figures & data
Figure 1. The number of marketplace lending platforms.
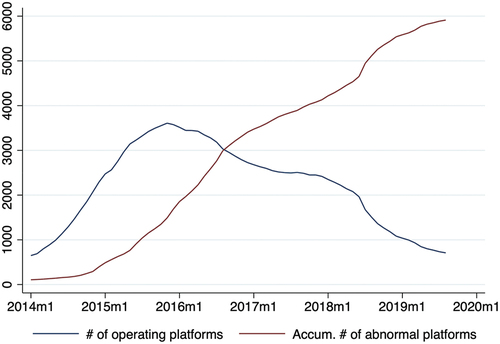
Figure 2. The number of active lenders and borrowers.
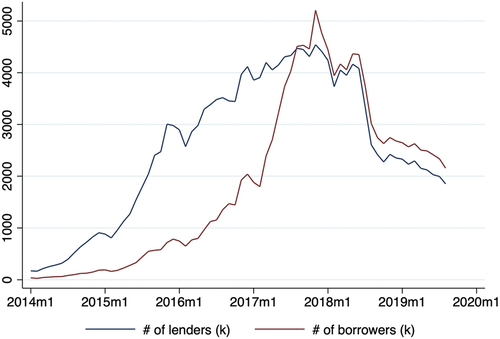
Table 1. Summary statistics.
Table 2. Scams and net capital inflow.
Table 3. Scams and concerns of risk.
Table 4. Scams and concerns of industry.
Figure 3. Heatmaps of the feature importance.
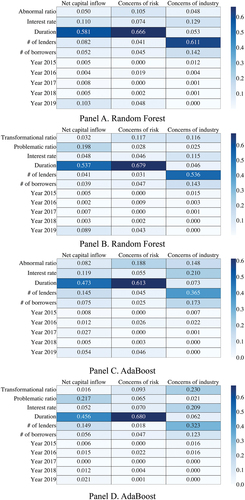
Table 5. Scams and investor confidence and attention: dynamic estimate.
Table 6. Scams and investor confidence and attention: heterogeneity across supervision stages.
Table 7. Scams and investor confidence and attention: heterogeneity across regions.
Table 8. Robustness tests: baseline results.
Table 9. Robustness tests: dynamic estimate.
Table 10. Robustness tests: heterogeneity across supervision stages.
Table 11. Robustness tests: heterogeneity across regions.
