Figures & data
Figure 1. Share of China’s BRI investment in China’s outward FDI (2005–2022).
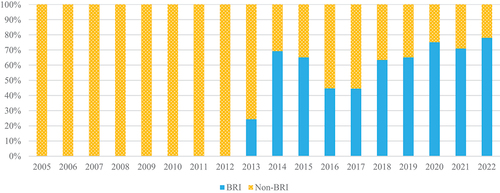
Figure 2. China’s BRI investment by sector (2013–2022) ($m).
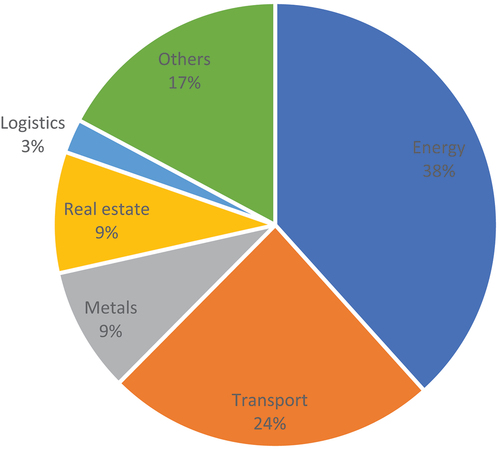
Figure 3. China’s BRI investment by region (2013–2022) ($m).
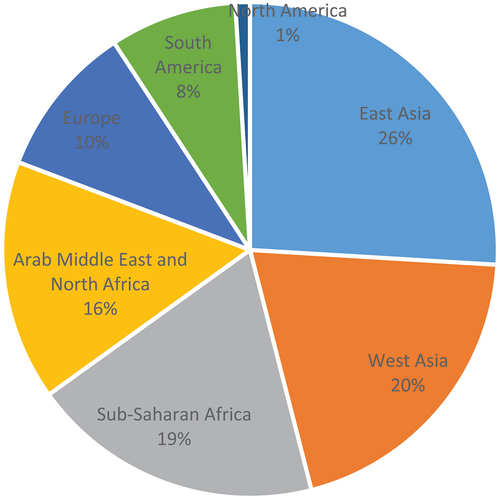
Figure 4. China’s share of global trade before and after the BRI.
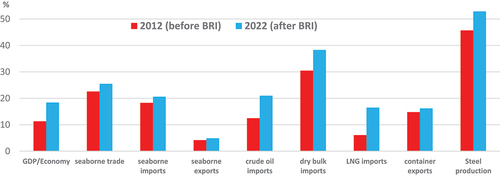
Table 1. Cape of good hope vs. Suez canal BRI distance savings.
Figure 5. Share of the SC transit numbers by vessel type in 2022.
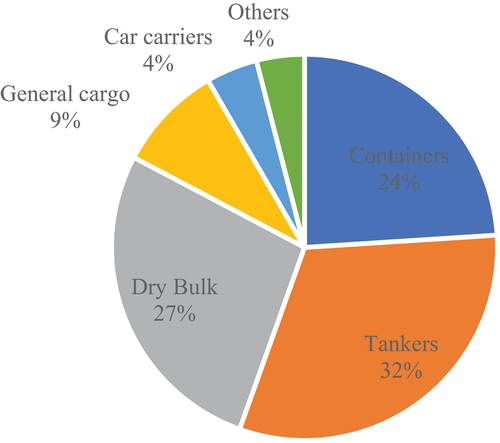
Figure 6. Share of the SC cargo trade by vessel type in 2022.
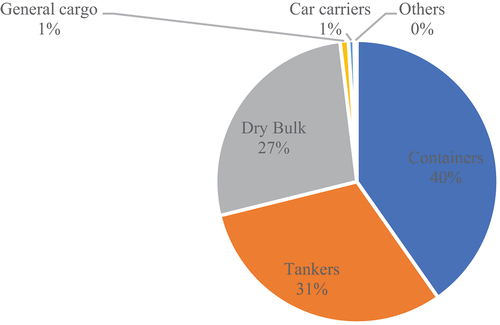
Table 2. Variables considered, their indicators, and sources.
Table 3. Variable descriptive statistics.
Table 4. ADF test results.
Table 5. Selection criteria for the VAR lag order.
Figure 7. The inverse roots of the AR characteristic polynomial.
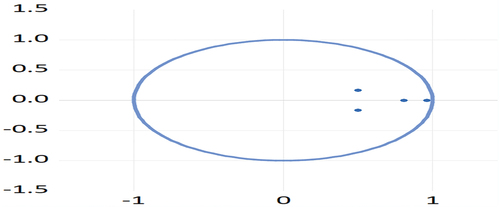
Table 6. The VAR model results.
Figure 8. Short-run causal relations between SC cargo trade, China’s seaborne trade, China’s BRI, and SC development projects.
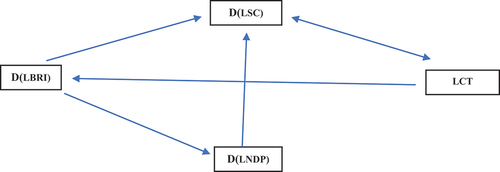
Figure 9. Response of SC cargo trade to China’s seaborne trade.
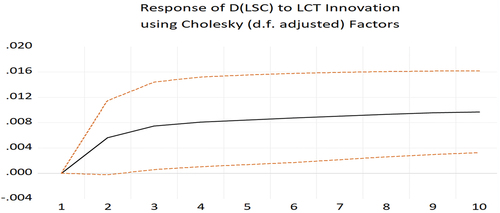
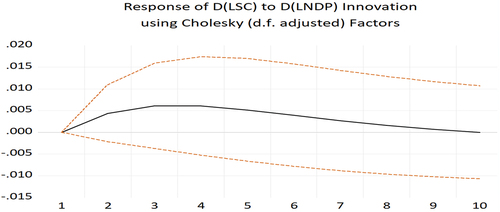
Figure 10. Response of SC cargo trade to China BRI investment.
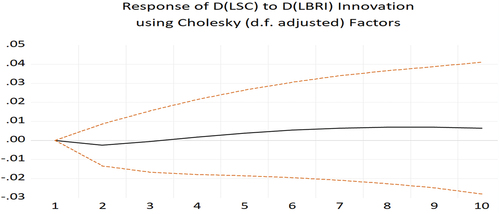
Figure 11. Response of SC cargo trade to SC new development projects.