
Figures & data
Table 1. GIBM evaluation index system.
Table 2. Classification basis of the four major sectors.
Figure 1. Overall evolution of GIBM in China.
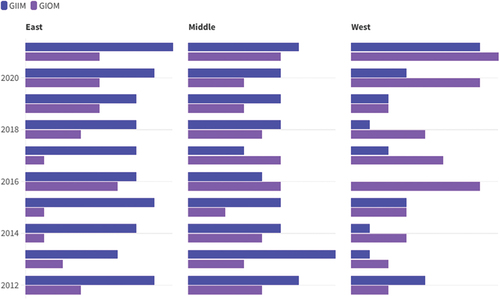
Figure 2. GIBM trends in China.
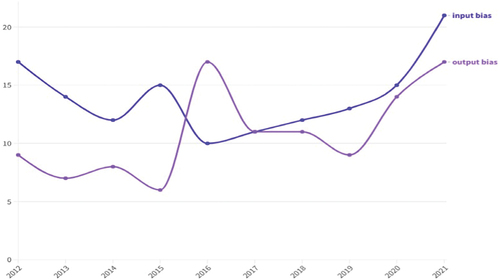
Figure 3. Overall evolution of GIIM in China.
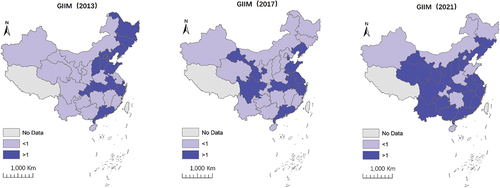
Figure 4. China GIIM Spatial Association Network in 2012.
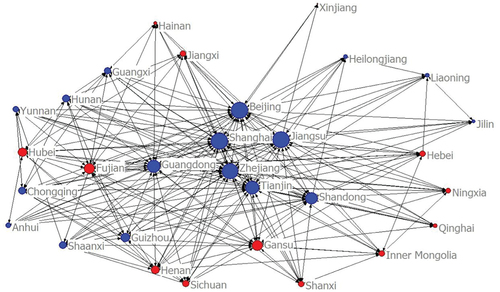
Figure 5. China GIIM Spatial Association Network in 2016.
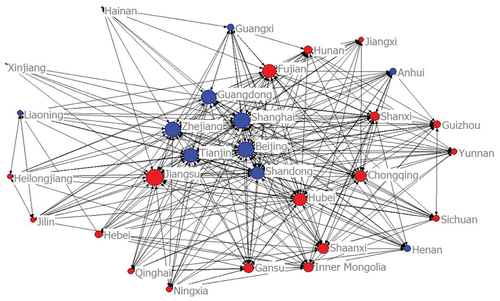
Figure 6. China GIIM Spatial Association Network in 2021.
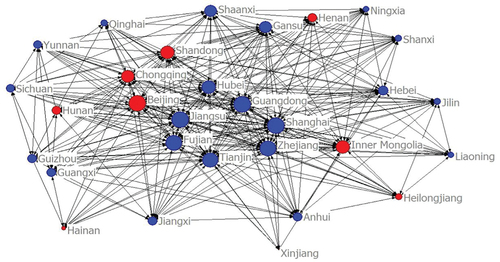
Figure 7. Network density and association from 2012 to 2021.
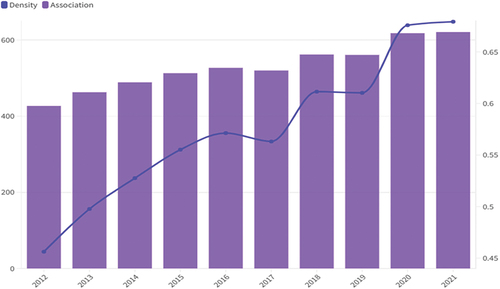
Table 3. Connectedness,hierarchy and efficiency.
Figure 8. Evolution of small-world characteristics of spatially linked networks.
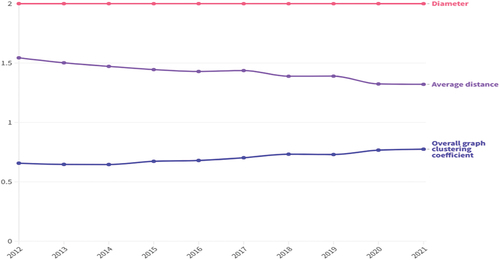
Figure 9. Centrality analysis in 2012.
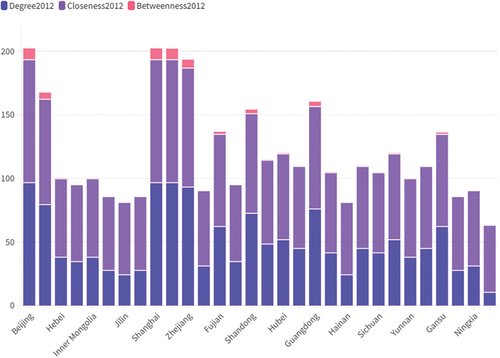
Figure 10. Centrality analysis in 2016.
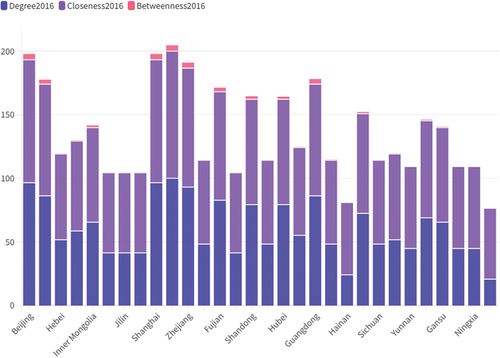
Figure 11. Centrality analysis in 2021.
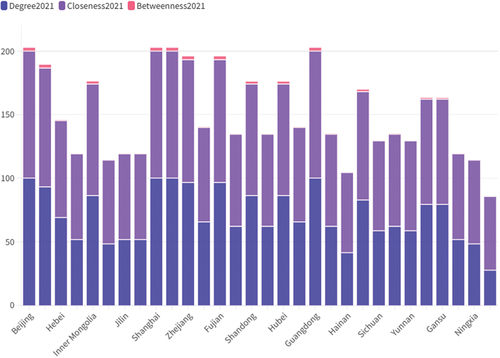
Figure 12. Structural hole indicator of China’s GIIM in 2021.
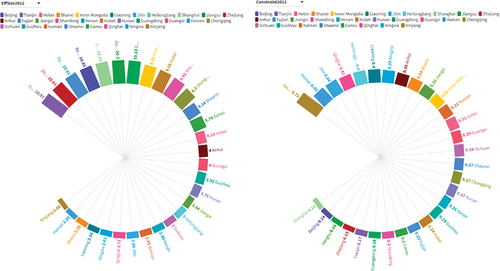
Figure 13. Core-edge structure of GIIM spatial associations, 2012, 2016 and 2021.
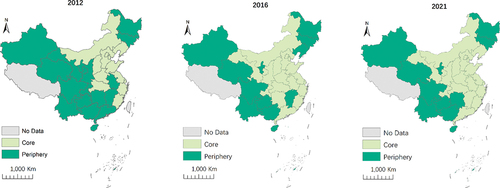
Figure 14. Correlation among the four GIIM blocks in 2021.
Table 4. Classification of GIBM space-related network blocks in 2012.
Table 5. Classification of GIBM space-related network blocks in 2016.
Table 6. Classification of GIBM space-related network blocks in 2021.
Table 7. OLS regression results of the whole network structure effect.
Table 8. Regression results of the ego-network structure effect.
Table 9. Correlation analysis.
Table 10. QAP regression analysis.
