
Figures & data
Figure 1. Components of income inequality in South Africa.
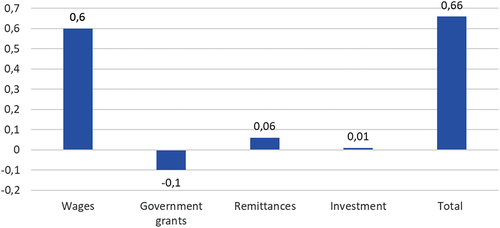
Figure 2. Presence of earners in the household in per cent by income decile.
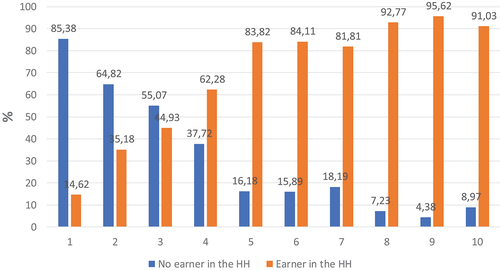
Figure 3. coefficients of inflation persistence.
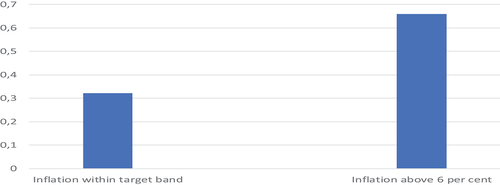
Figure 4. The transmission of the positive inflation shocks to income inequality.
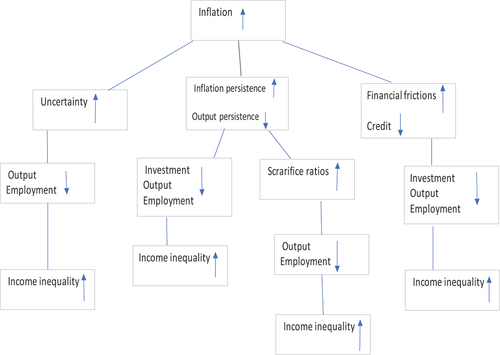
Figure 5. Inflation trajectories and periods when inflation was within the target band.
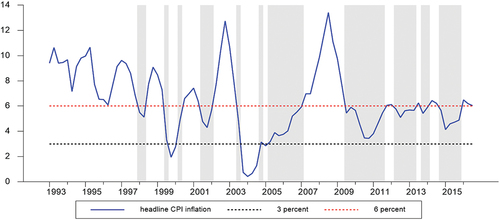
Figure 6. Income inequality and inflation dynamics.
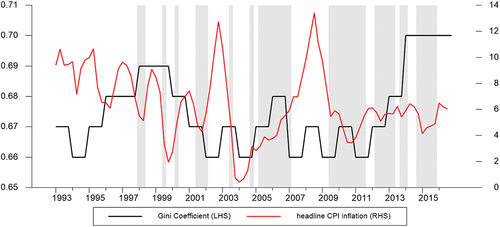
Table 1. Unit root tests.
Figure 7. Income inequality responses in baseline VAR model.
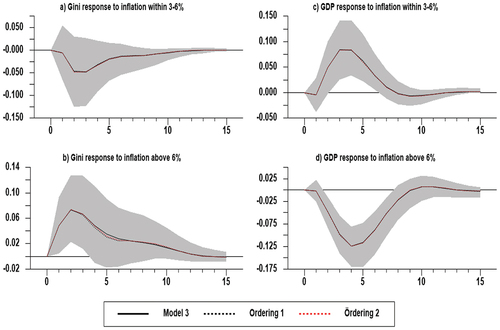
Figure 8. Comparisons of the responses of income inequality growth and employment growth to a positive inflation shock.
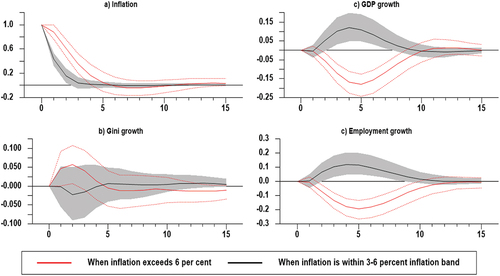
Figure 9. Comparisons of the responses of income inequality growth and employment growth to a positive inflation shock.
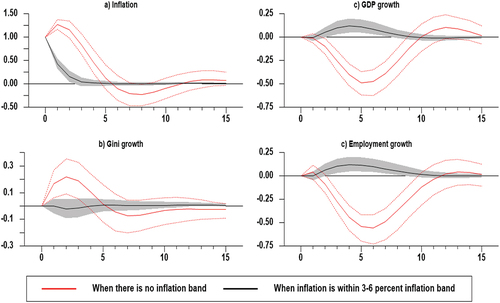
Figure 10. Comparisons of the responses of income inequality growth and employment growth to a positive inflation shock in 2000Q1 to 2016Q4.
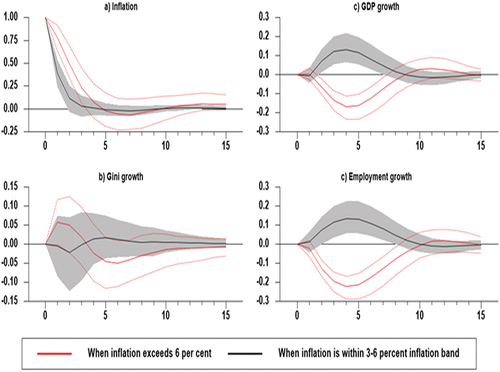
Figure 11. Comparisons of the responses of income inequality growth and employment growth to positive inflation shock in 2000Q1 to 2016Q4.
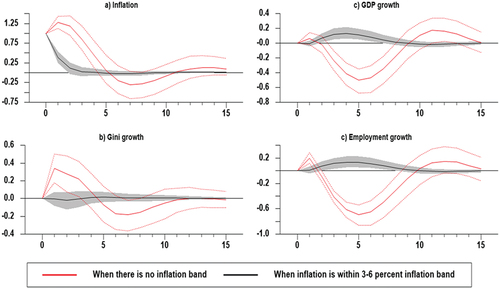
Table 2. Forecast error variance decompositions of income inequality growth.
Table 3. Forecast error variance decompositions of income inequality growth in per cent.
Figure 12. Responses of income inequality growth and GDP growth to positive inflation shock according to inflation bands.
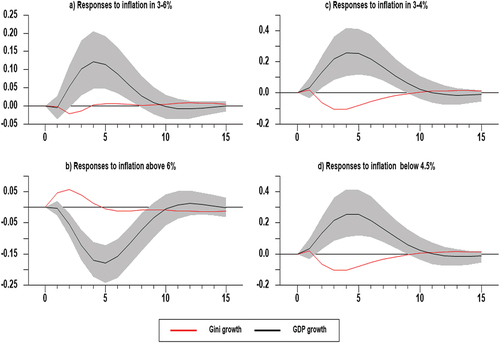
Figure 13. Responses of income inequality growth and employment growth to positive inflation shock according to inflation thresholds.
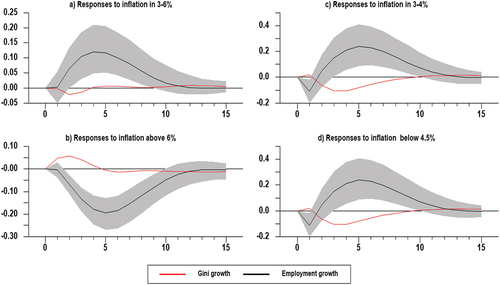
Figure A1. Responses in the 2000Q1 to 2016Q4.
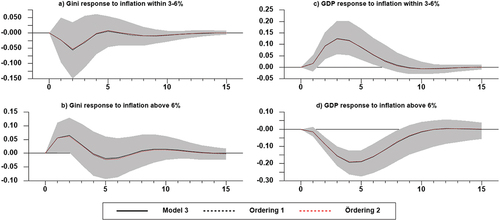
Figure A2. Responses in the 1993Q1 to 2016Q4.
Figure A3. Responses in the 1993Q1 to 2016Q4.
Figure A4. Responses in the 1993Q1 to 2016Q4.
Data availability statement
The data that support the findings of this study are available from the author, upon reasonable request.