
Figures & data
Table 1. Definition of variables.
Figure 1. Evolution of income inequality in developing countries, 2000–2020.
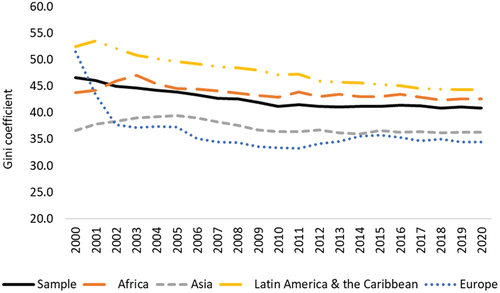
Figure 2. Evolution of world uncertainty index, developing countries.
The WUI is computed by counting the percent of the word “uncertain” (or its variant) in the Economist Intelligence Unit country reports. The WUI is then rescaled by multiplying by 1,000,000. A higher number means higher uncertainty and vice versa. For example, an index of 200 corresponds to the word uncertainty accounting for 0.02 percent of all words, which means about 2 words per report.
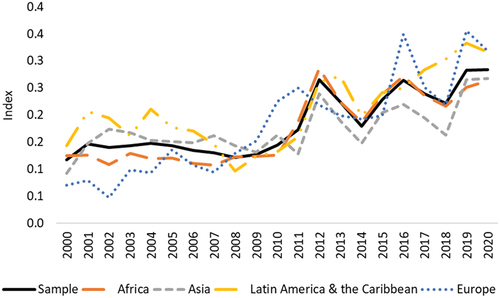
Figure 3. World uncertainty and income inequality in developing countries (average 2000–2020).
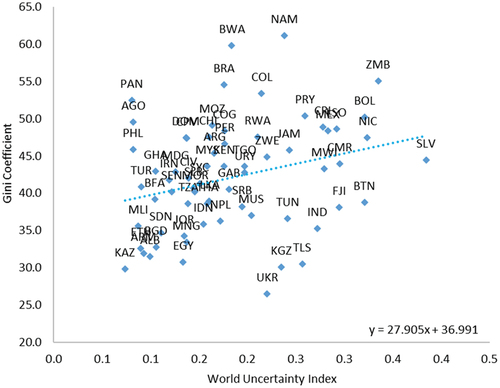
Figure 4. Uncertainty and income inequality according to the country’s fiscal position (average 2000–2020).
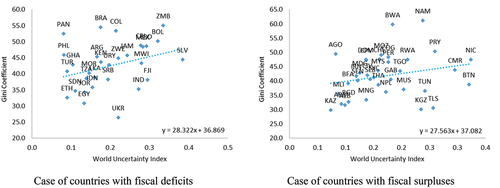
Table 2. Baseline results.
Table 3. Robustness test: baseline results considering economic policy uncertainty.
Table 4. Robustness test: baseline results considering trade policy uncertainty.