
Figures & data
Table 1. Summary of the descriptive statistics.
Figure 1. Graphs of annual per capita income (constant 2015 US$) for different regions’ trends.
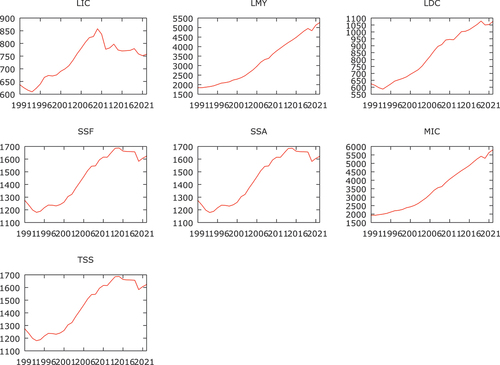
Figure 2. Manufacturing value added (% of GDP) growth trends. It describes the share of manufacturing to GDP trends the y-axis refers to manufacturing, value added measured using constant 2015 US$; the x-axis refers to the time periods over the period 1996–2022.
Figure 3. Manufacturing, value added (% of GDP) growth trends the y-axis refers to manufacturing, value added measured using constant 2015 US$; the x-axis refers to the time periods over the period 1996–2022.
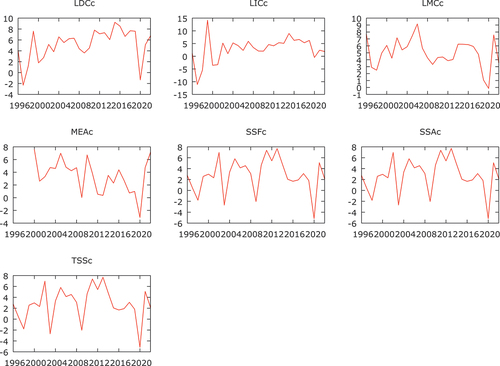
Figure 4. Manufacturing, value added (constant 2015 US$) trend overtime. The y-axis refers to manufacturing, value added measured using constant 2015 US$; the x-axis refers to the time periods over the period 1996–2022.
Table 2. Results of the cross-sectional dependence test with the help of pesaran CD test.
Table 3. The effect of institutional quality on structural transformation in the short-run.
Table 4. The effect of institutional quality on structural transformation in the long run.