Figures & data
Figure 1. Log of real GDP (left) and growth rate of real GDP (right) with mixed-frequency VAR using credit-augmented divisia.
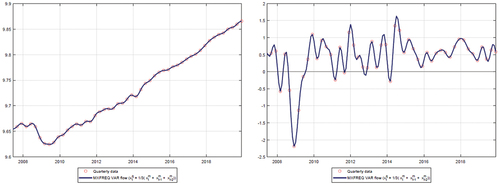
Figure 2. VAR forecasting using credit-augmented divisia M2I.
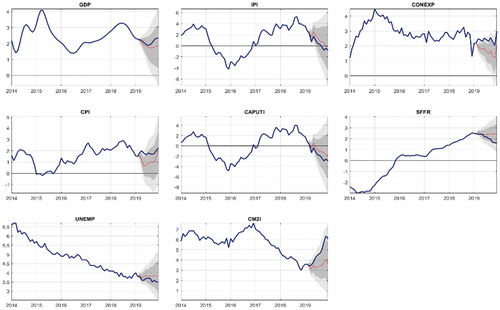
Table 1. Sign restrictions with use of credit-augmented divisia M2I.
Figure 3. 1,000-rotations of impulse responses to demand shock (upper-left), supply shock (upper-right), monetary policy shock (down-left), credit supply shock (down-right) with data including credit-augmented divisia M2I.
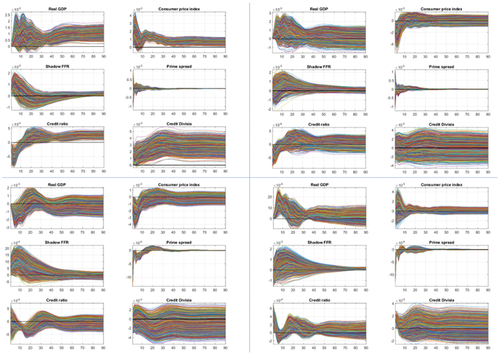
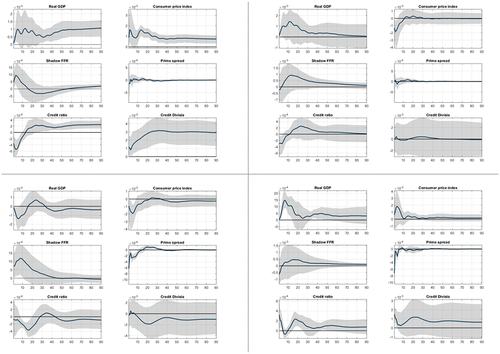
Figure 4. Impulse responses to demand shock (upper-left), supply shock (upper-right), monetary policy shock (down-left), and credit supply shock (down-right) with data set including credit-augmented divisia M2I.
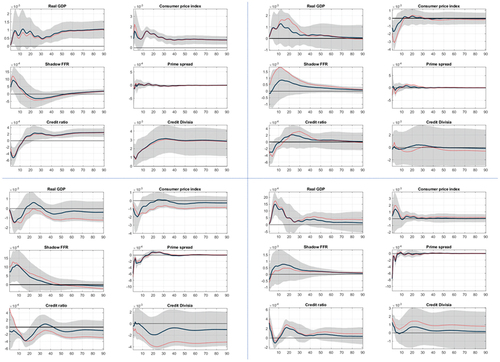
Table 2. Median target forecast error variance decomposition, credit-augmented divisia M2I.
Figure 5. Historical decomposition of real GDP, CPI, and credit-augmented divisia.
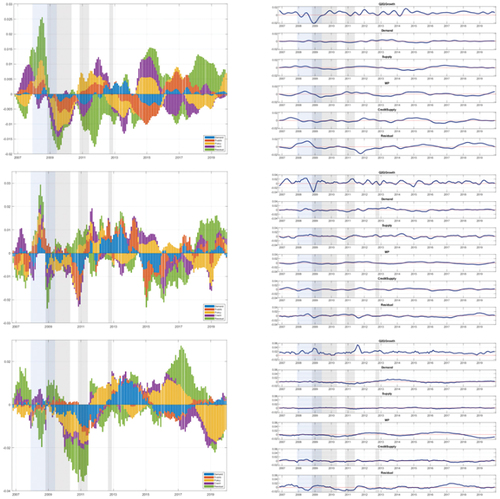
Figure 6. The first row displays behavior of supply shock and growth of CPI, with credit-augmented divisia M2I on the left and simple sum M2 on the right. The second row displays the behavior of credit supply shock and growth of monetary aggregates, with credit-augmented divisia M2I on the left and simple sum M2 on the right.
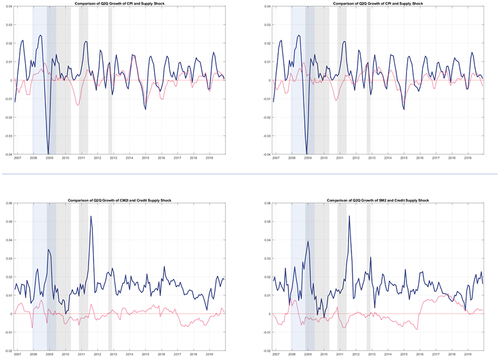
Table A1. Data information for back-casting.
Table A2. Data information for VAR-Sign restriction.
Table A3. Sign restriction using simple sum M2.
Table A4. Median target forecast error variance decomposition using simple sum M2.
Figure B1. Log of real GDP (left), growth rate of real GDP (right). Mixed-frequency VAR using simple sum M2.
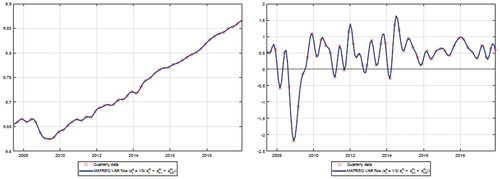
Figure B2. VAR forecasting using simple sum M2.
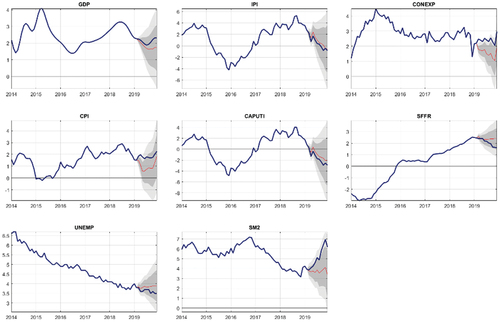
Figure B3. 1,000-rotations of impulse responses to demand shock (up-left), supply shock (up-right), monetary policy shock (down-left), credit supply shock (down-right) with data set including SM2.
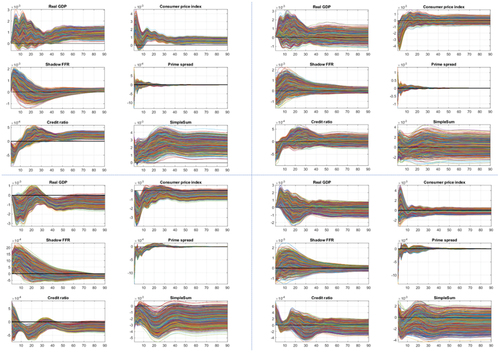
Figure B4. Impulse responses to demand shock (up-left), supply shock (up-right), monetary policy shock (down-left), and credit supply shock (down-right) with data including SM2.
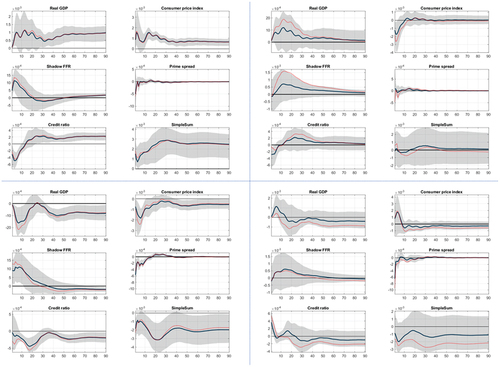
Figure B5. Historical decomposition of real GDP, CPI, and simple sum M2.
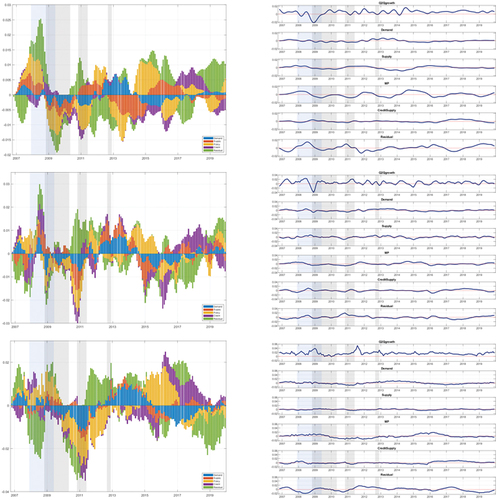
Figure C1. Impulse responses to demand shock (upper-left), supply shock (upper-right), monetary policy shock (down-left), and credit supply shock (down-right) with data set including credit-augmented divisia M2I, lag extension.
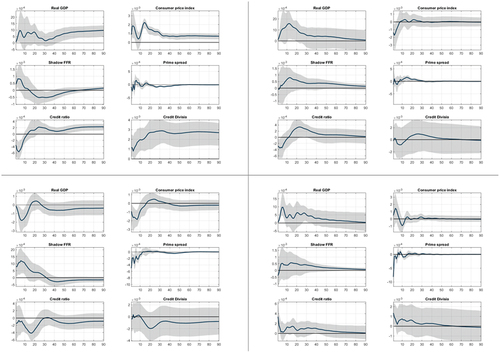
Figure C2. Impulse responses to demand shock (upper-left), supply shock (upper-right), monetary policy shock (down-left), and credit supply shock (down-right) with data set including credit-augmented divisia M2I, imposing the restrictions in the first period after impact.