Figures & data
Figure 1. Monthly time series plots of the HICP series in the EU27 countries (2015 = 100).
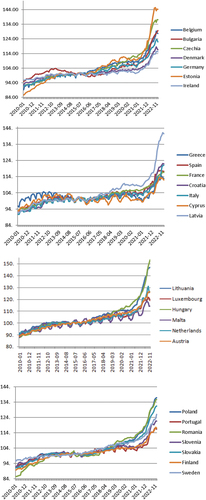
Table 1. Estimates of the differencing parameter. Sample ending in December 2019.
Table 2. Estimated coefficients in selected models. Sample ending in December 2019.
Table 3. Estimated coefficients in selected models. Sample ending in January 2022.
Table 4. Estimated coefficients in selected models. Sample ending in December 2022.
Table 5. Summary of the estimates of d.
Figure 2. Recursive estimates of d as a measure of price persistence.
The first estimate is d is based on a sample ending in December 2019, then one observation at a time is added recursively to obtain the following estimates. Thus, observation 1 corresponds to the sample ending in January 2020, observation 2 to the one ending in March 2020, etc. The red line corresponds to the estimated values of d whilst the black ones show the 95% confidence intervals.
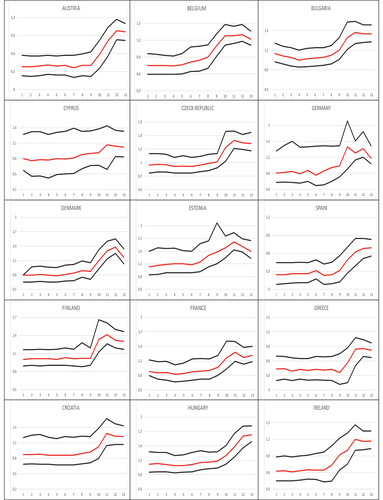
Figure 2. (Continued).
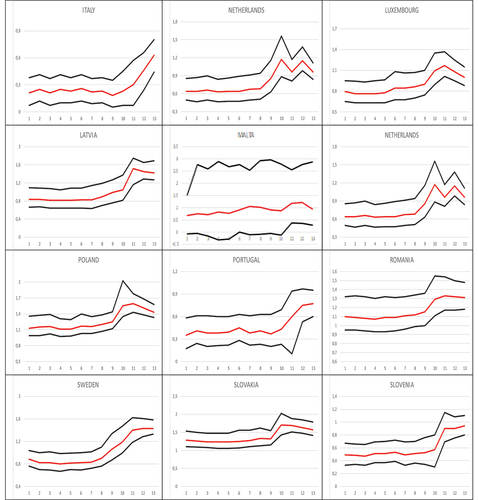
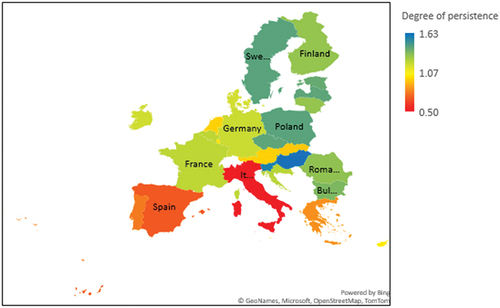
Figure 3. Coloured geographical map of the degree of persistence of the EU27 countries in the full sample.