
Figures & data
Table 1. Descriptive statistics.
Table 2. Baseline regression results.
Figure 1. Left: green patents for inventions, Right: green patents for practical applications.
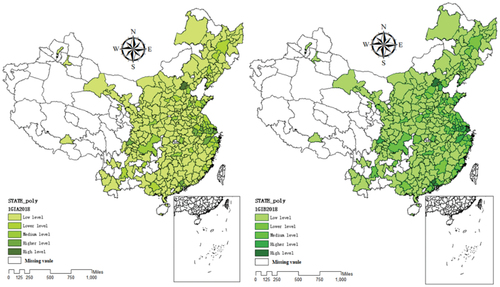
Figure 2. Left: without the environment, Right: with the environment.
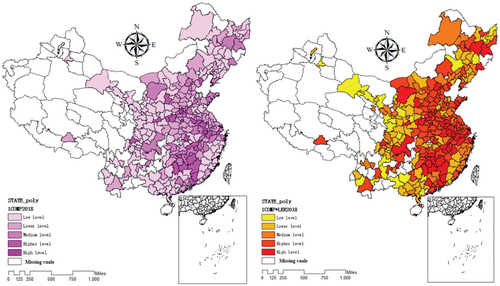
Table 3. Interactive effects of local government competition and environmental regulation.
Table 4. Interactive effects of local government competition and environmental regulation.
Table 5. Estimation results of replacing explanatory variables.
Table 6. Estimation results excluding special samples.
Table 7. Tests for fiscal spending bias interaction effects.
Table 8. Tests for development area interaction effects.
Table 9. Tests for heterogeneity in development areas.
Table 10. Threshold model parameter estimates.
