Figures & data
Figure 1. Multiple exact solutions.
Figure 2. A unique exact solution.
Figure 3. A unique approximate solution on an edge.
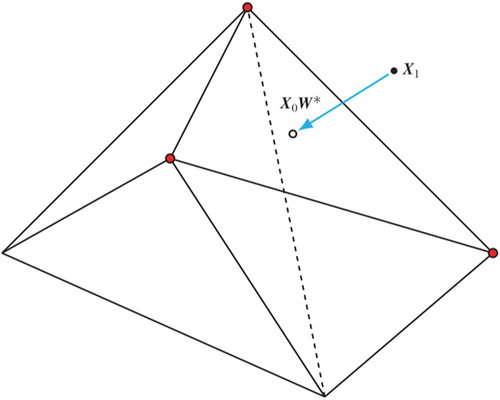
Figure 4. A unique approximate solution on a vertex.
Figure 5. Approximate solutions that are not unique.
Table 1. A case study of California’s tobacco control program.
Figure 6. Optimal synthetic control in the 2D parameter space.
Figure 7. Optimal synthetic control in the 3D parameter space.
Table 2. Summary statistics.
Figure 8. The distribution of sparsity.
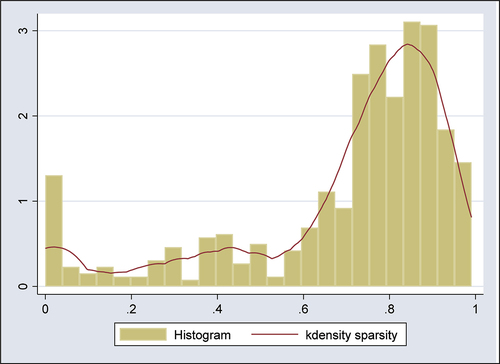
Figure 9. The numbers of positive weights and covariates.
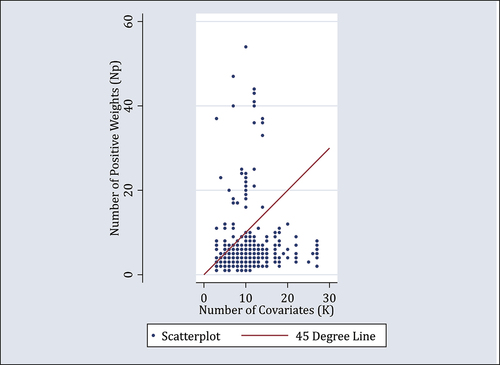
Figure 10. The number of positive weights and the number of covariates.
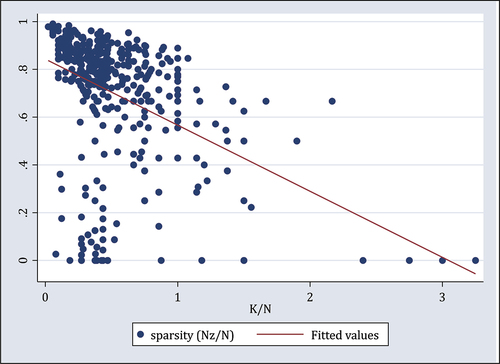
Table 3. Results of OLS regressions.
Table 4. Results of fractional probit regressions.
Table 5. Results of fractional logit regressions.
Figure A1. Projecting on the convex hull of
.