
Figures & data
Figure 1. Kernel density of wage by union membership and gender. (a) Union members, (b) Non-union members.
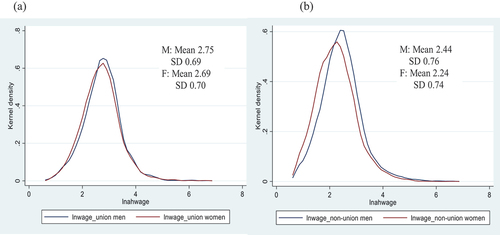
Table 1. Gender disparities in individual characteristics among union and non-union members.
Table 2. Gender disparities in union wage premium.
Table 3. Robustness test of the gender gap in union wage premiums.
Table 4. Gender disparities in the probability of obtaining union membership.
Table 5. Decomposition results of gender wage gap based on the O-R method.
Table 6. Decomposition results of gender wage gap based on the D-R method.
Table A1. Definition and descriptive statistics of variables (total samples).
Data availability statement
The dataset used in this study was obtained from the China Family Panel Studies (CFPS) and is publicly available (http://opendata.pku.edu.cn/en). The dataset and materials constructed during this study are available from the corresponding author upon request.