715
Views
0
CrossRef citations to date
0
Altmetric
Research Article

The Dynamics of Information-Seeking Repertoires: A Cross-Sectional Latent Class Analysis of Information-Seeking During the COVID-19 Pandemic

ORCID Icon, ORCID Icon & ORCID Icon

Figures & data

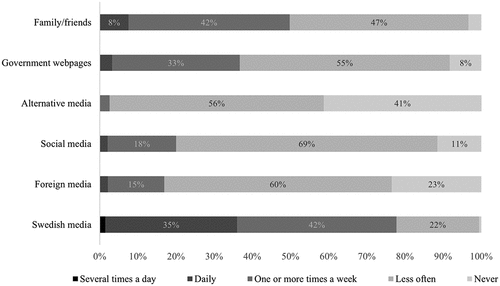
Figure 1. Item response probabilities: alternative pluralists (wave 1).
Note: Range is from high to low: dark = high use; light = low use. Missing data modeled at listwise deletion. Total N = 9240.
Figure 1. Item response probabilities: alternative pluralists (wave 1).

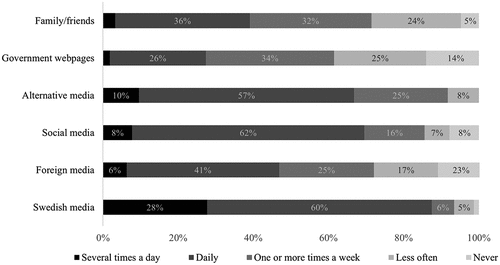
Figure 2. Item response probabilities: mainstream pluralists (LFU) (wave 1).
Note: Range is from high to low: dark = high use; light = low use. Missing data modeled at listwise deletion. Total N = 9240.
Figure 2. Item response probabilities: mainstream pluralists (LFU) (wave 1).

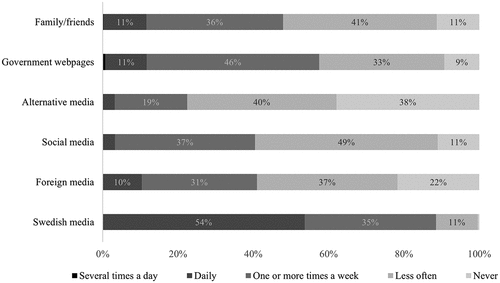
Figure 3. Item response probabilities: mainstream pluralists (FU) (wave 1).
Note: Range is from high to low: dark = high use; light = low use. Missing data modeled at listwise deletion. Total N = 9240.
Figure 3. Item response probabilities: mainstream pluralists (FU) (wave 1).

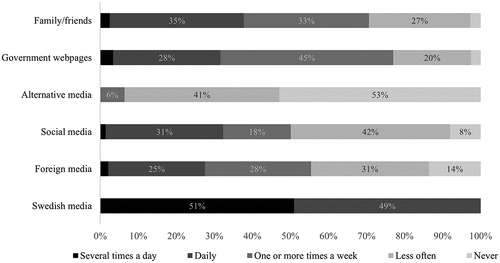
Figure 4. Item response probabilities: news junkies (wave 1).
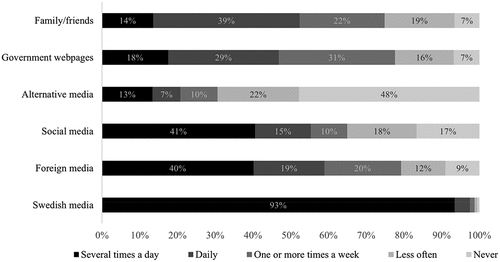
Note: Range is from high to low: dark = high use; light = low use. Missing data modeled at listwise deletion. Total N = 9240.
Figure 4. Item response probabilities: news junkies (wave 1).

Figure 5. Item response probabilities: minimalists (wave 2).
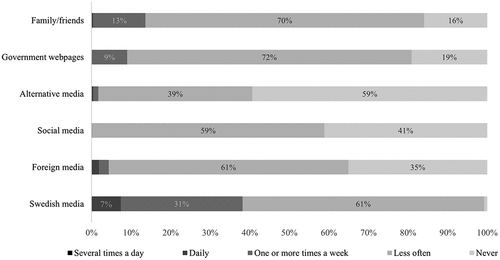
Note: Range is from high to low: dark = high use; light = low use. Missing data modeled at listwise deletion. Total N = 8790.
Figure 5. Item response probabilities: minimalists (wave 2).

Figure 6. Item response probabilities: selective minimalists (wave 2).
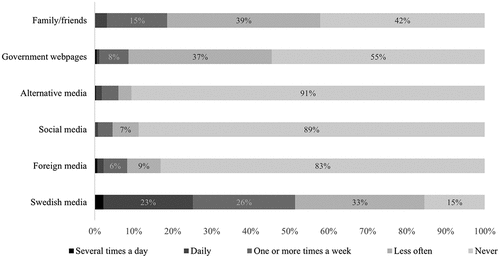
Note: Range is from high to low: dark = high use; light = low use. Missing data modeled at listwise deletion. Total N = 8790.
Figure 6. Item response probabilities: selective minimalists (wave 2).

Figure 7. Item response probabilities: news-oriented traditionalists (wave 1).
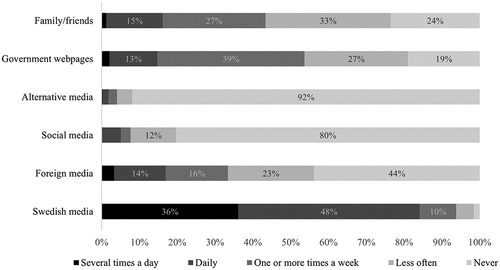
Note: Range is from high to low: dark = high use; light = low use. Missing data modeled at listwise deletion. Total N = 9240.
Figure 7. Item response probabilities: news-oriented traditionalists (wave 1).

Figure 8. Item response probabilities: socially-oriented traditionalists (wave 4).

Note: Range is from high to low: dark = high use; light = low use. Missing data modeled at listwise deletion. Total N = 7898.
Figure 8. Item response probabilities: socially-oriented traditionalists (wave 4).

Figure 9. Timeline of identified information-seeking repertoires according to phases.

Figure 9. Timeline of identified information-seeking repertoires according to phases.
Supplemental material

Supplemental Material

Download PDF (226.6 KB)

Data availability statement

Data is available on request from the corresponding author due to privacy/ethics restrictions.