
Figures & data
Table 1. Profile of survey respondents (n = 24).
Figure 1. Teaching experience of respondents (n = 25).
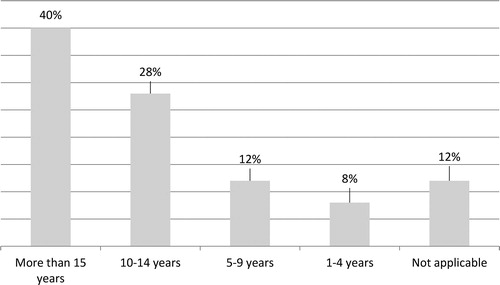
Figure 2. Age of real estate program (n = 25).
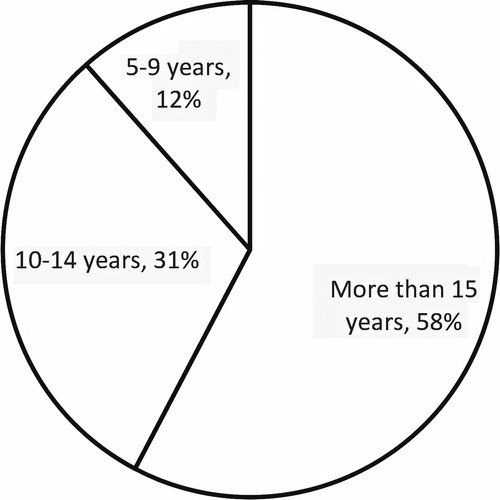
Table 2. Respondent by type of real estate program (n = 26).
Table 3. Duration of real estate program (n = 26).
Table 4. Student services and their importance in relation to future employment (n = 26).
Table 5. Most important skills and competencies for employment (n = 25).
Table 6. The right tools for the job (n = 23).
Table 7. Percentage of full-time students working while in school (n = 23).
Table 8. Percentage of students obtaining full-time employment within a program (n = 22).
Table 9. Real estate employment (n = 20).
Table 10. Student choice of jobs by criteria (n = 19).
Table 11. Student preparedness for the fourth industrial revolution (n = 18).