Figures & data
Table 1. Initial soil and poultry litter nutrient and heavy metal properties.
Table 2. Recurrent dominant plant species on experimental plots over the first and second year.
Figure 1. Monthly precipitation (mm) and mean temperature (oC) records of the experimental region during the study and growing seasons (usclimatedata.com).
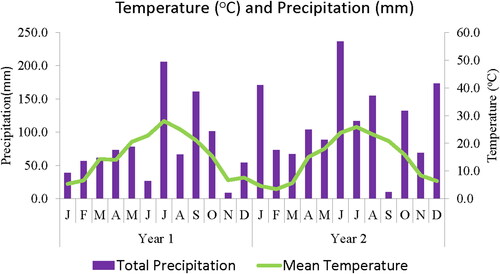
Figure 2. Monthly precipitation (mm) and Cumulative Growing Degree Days (GDD) oC records of experimental region during the study and growing seasons (usclimatedata.com).
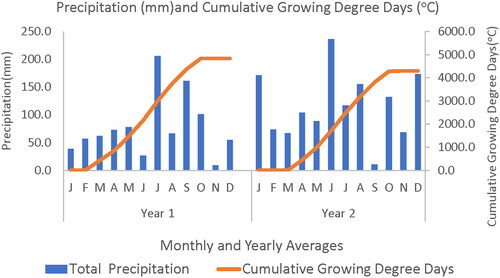
Table 3. Means of biomass, and nutrient and metal uptake by Native Vegetation with (NVM) and without manure (NVN) for five cuttings.
Table 4. Biomass, and nutrient and metal uptake for five bi-monthly harvests.
Table 5. Total Nitrogen (N) concentration in plants for Native Vegetation without Manure (NVN) and Native vegetation with Manure (NVM) for the first and second year.
Table 6. Soil pH, EC, and concentration of nutrients with (NVM) and without (NVN) poultry manure.
Table 7. Soil pH, EC, and Nutrients as a function of soil depth in soils treated with and without poultry manure.
Table 8. Nitrate and Ammonium concentrations in the manure and no-manure treated soils.
Figure 3. (a) Concentration of Nitrate in Water samples for fertilized and non-fertilized plots for Year 1. (b) Concentration of Ammonium in Water samples for fertilized and non-fertilized plots for Year 1.
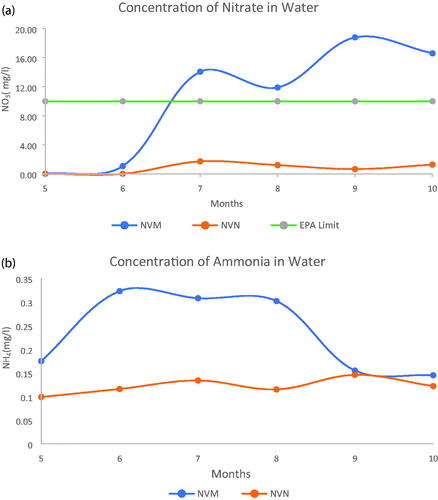
Figure 4. (a) Concentration of Nitrate in Water samples for fertilized and non-fertilized plots for Year 2. (b) Concentration of Ammonium in Water samples for fertilized and non-fertilized plots for Year 2.
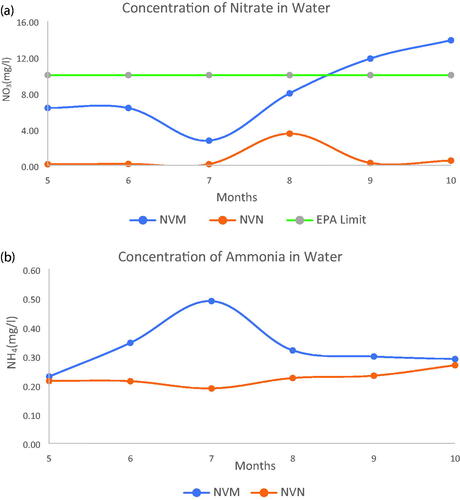
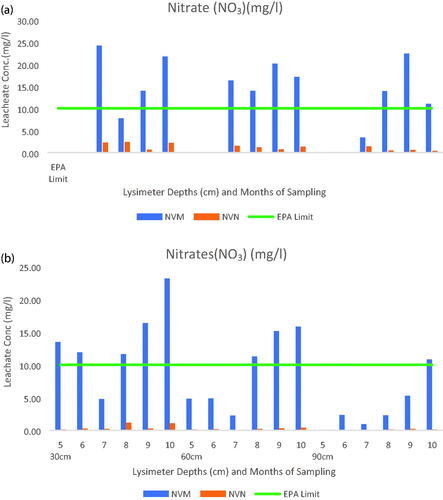
Figure 5. (a) Lysimeter samples for Monthly Nitrate Concentration for Year 1. (b) Lysimeter samples for Monthly Nitrate Concentration for Year 2.