
Figures & data
Table 1. Mixing ratios, pH and element composition (nutrients and metals) of the five substrates (CON, and two dilutions of each from the Mansfeld (M) and the Davidschacht (D) mine wastes) that were used in the experiments. In the final columns, heavy metal concentrations in the substrates can be compared to the limits for sandy and clayey agricultural soils that have been set by the German Soil Protection Ordnance (BBSchV Citation2021).
Figure 1. Photographs showing the established vegetation on the mesocosm in the seasons 2021 (left) and 2022 (right). The 42 trays were arranged after blocks for the two grassland mixtures (RIES and GRIES) and after seven rows for the treatments. While the treatments CON, CON 1 and CON2 were based on unpolluted substrates, the other four made use of two mine wastes from either the Davidschacht (D) or the Mansfeld (M).
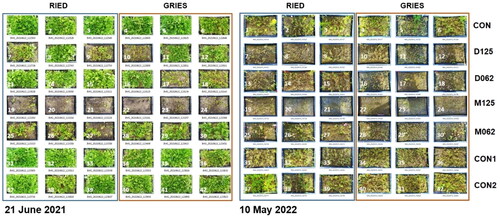
Figure 2. Dry shoot biomass produced in the wet (above, blue) and dry (below, orange) grassland mixtures during the first 92 days of the experiment (left) and loss of solids due to the draining of water in the first season (right). In each of the panels, boxplots are arranged after the control (CON, left) greywater (CON1, CON2) and mine waste treatments (see x-axes). The intensity of color shading is sorted after the median values. Same letters above the boxes indicate non-significant differences between the treatments in post-hoc multiple comparisons (Tukey tests).
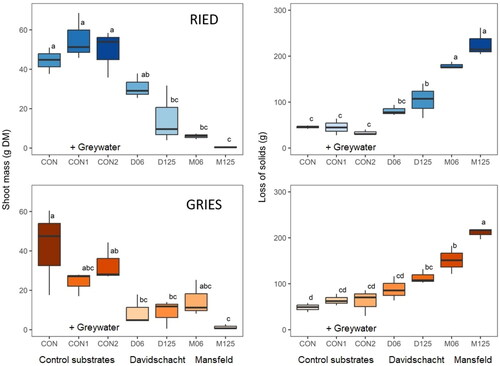
Table 2. Correlation matrix for 25 variables addressed in the mesocosm study. Positive product moment coefficients are indicated in lighter and darker blue (r > 0.5, r > 0.8) and negative relationships are indicated in lighter and darker orange (r< −0.5, r < −0.8). The upper triangle refers to the calculation of data from the GRIES grassland, while the lower represents the data from the RIED mesocosms. For the abbreviations of the parameters refer to the materials and methods section.
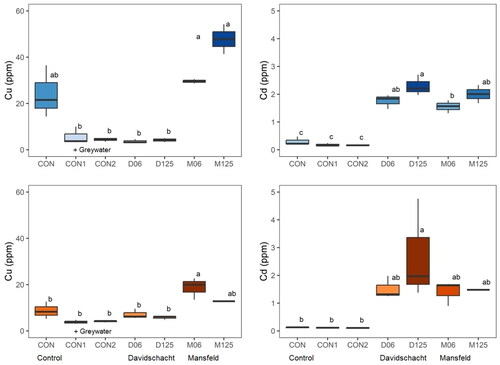
Figure 3. Copper (Cu, ppm) concentrations in the shoot dry biomass produced in the wet (above, blue) and dry (below, orange) grassland mixtures during the first 92 days of the experiment (left) and the respective cadmium (Cd, ppm) concentrations (right). In each of the panels, boxplots are arranged after the control (CON, left) greywater (CON1, CON2) and mine waste treatments (see x-axes). The intensity of color shading is sorted after the median values. Same letters above the boxes indicate non-significant differences between the treatments in post-hoc multiple comparisons (Tukey tests).
Supplemental Material
Download MS Word (1.1 MB)Data availability statement
Data are available in the supplementary information (SI) to this article.