Figures & data
Figure 1. Responses to “Relating to your last five publications, how often did you incorporate the following visualizations?” Numbers in brackets show how many responded to the item. Percentages are grouped into never/rarely, sometimes, and often/always.
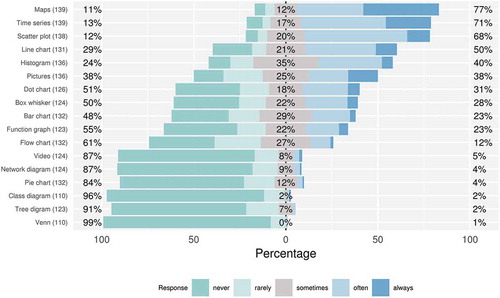
Figure 2. Responses to the question: “While reading a scientific publication related to my own research, I would like to ….” Numbers in brackets show how many responded to the particular item. Percentages are grouped into strongly disagree/disagree, neither agree nor disagree, agree/strongly agree.
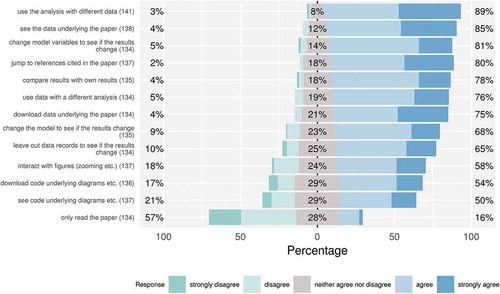
Figure 3. Pictures used to inspire interviewees who struggled with imagining interactive components in static papers. Left: Map of earthquake events in the Pacific (https://cran.r-project.org/web/packages/leafletR/leafletR.pdf). Right: Daytime pattern of air temperature (El-Madany et al., Citation2016).
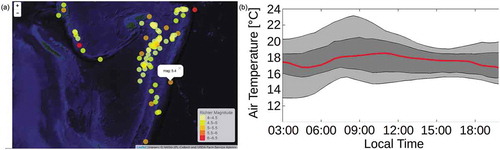
Figure 4. Mockups used to inspire participants and to present the idea of a reproducible research platform. Left: research components, possibility to re-run the analysis in the lower left corner, and the static paper. Right: interactive view enriched by UI widgets to change values.
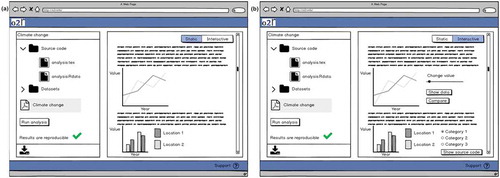
Figure 5. The extended workflow for examining reproducible scientific papers. The steps discovery, inspection (passive tasks, e.g. looking at components), manipulation, and substitution (active tasks, e.g. modifying parameters or replacing underlying components) each contribute to the readers understanding. The knowledge gain is probably not equal as suggested by the step height. Comparison is considered as a cross-cutting task relevant in each step.
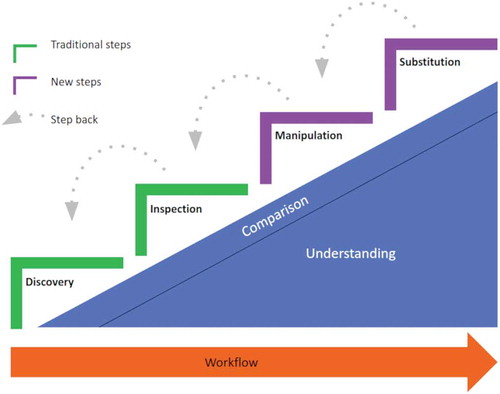
Figure 6. Implementation of the workflow step discovery. Readers can create queries using spatial (map), temporal, thematic (keywords), and source code-specific properties (libraries).
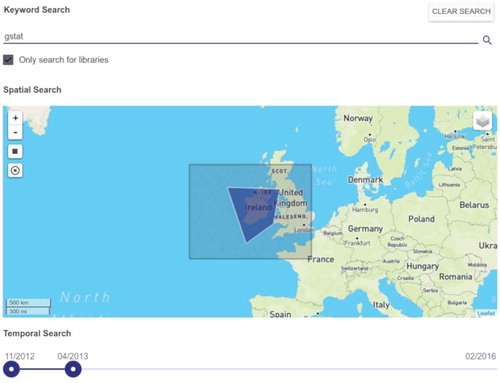
Table 1. Requested tasks while examining a paper assigned to the four workflow steps. Numbers in brackets indicate how many mentioned the task (#interviewees; #focusGroupParticipants).
Figure 7. Inspection: Readers can read the paper (left) and at the same examine the underlying source code and dataset to understand how the reported results were computed (right).
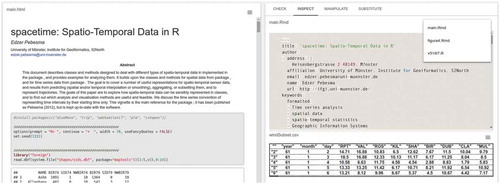
Figure 8. Manipulation: Readers can change the model of the variogram underlying the kriging interpolation by using option buttons to see how the results change (right), and examine only those parts of the source code and data subsests that were used to produce the figure (left).
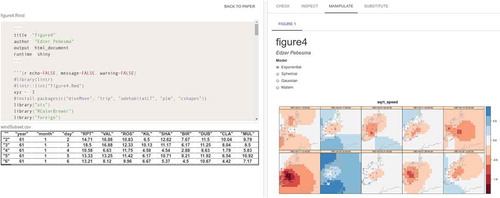
Figure 9. Substitution: Readers can substitute the dataset underlying a paper (base Executable Research Compendium, ERC) by data from another paper containing compatible data (overlay ERC).