
Figures & data
Figure 1. Example of a map-related task with a respective map design in the survey (note that the question corresponds to map-related task #16 of Annex in supplementary materials)
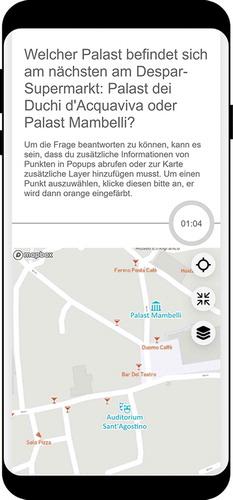
Table 1. Participant characteristics
Table 2. Map-related tasks and required types of interactivity
Table 3. Map elements
Figure 2. a) Dark theme base map with selectable line features of map-related tasks T4 and T5; b) Hybrid imagery base map with selectable polygon features of map-related task T6; c) Regular-density Mapbox Streets base map in combination with a selectable point feature; d) Dense Mapbox Streets base map in combination with two selectable point features
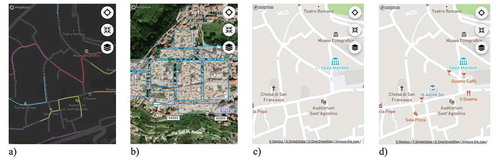
Table 4. Follow-up questions
Figure 3. Task success, comfort, and confidence ratings by map-related tasks
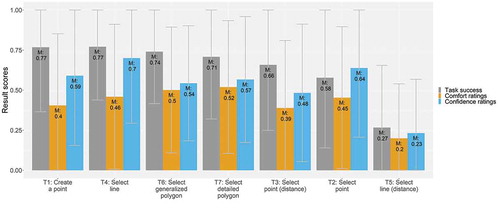
Figure 4. Task success, comfort, and confidence ratings by base map styles
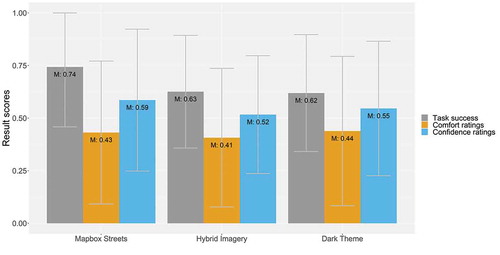
Figure 5. a) Task success, comfort, and confidence ratings by map detail densities; b) Task success, comfort, and confidence ratings by time pressure variants
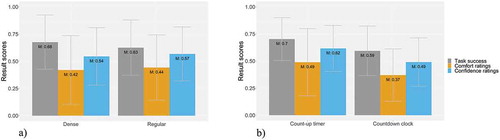
Figure 6. a) Task success, comfort, and confidence ratings of base map styles by map-related tasks; b) Task success, comfort, and confidence ratings of map detail densities by map-related tasks
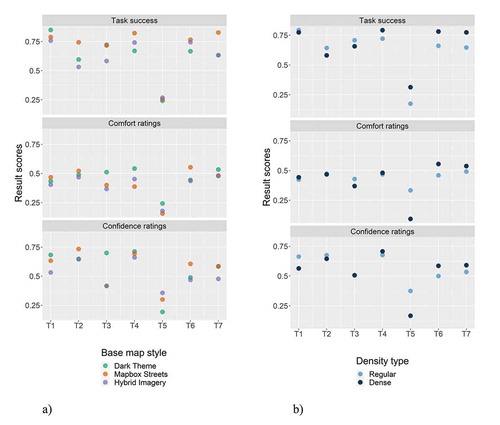
Figure 7. a) Task success, comfort, and confidence ratings of map detail densities by base map styles; b) Task success, comfort, and confidence ratings of time pressure variants by map-related tasks
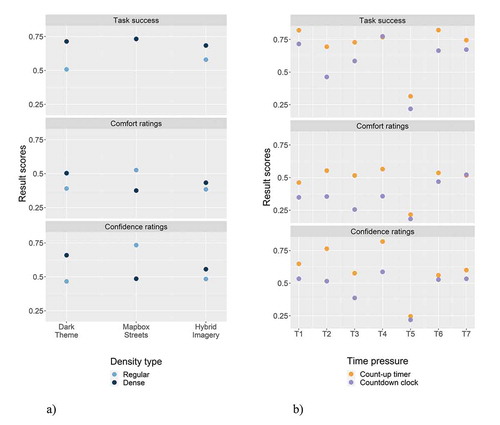
Table 5. Regression models with SBC and p-value with task success, comfort, and confidence ratings as dependent variables (with grayed-out areas indicating reference levels; 1 Regular-density as a reference level; 2 Count-up timer as a reference level; 3 Answer choice “no” as reference level)
Table 6. Perceived problems with map variations
Table 7. Positive and negative remarks as free-text feedback
Supplemental Material
Download MS Word (19.6 KB)Supplemental Material
Download MS Word (17 KB)Supplemental Material
Download MS Word (17 KB)Supplemental Material
Download MS Word (17 KB)Data availability statement
Participants of this study did not agree for their data to be shared publicly, so supporting data is not available.