
Figures & data
Figure 1. The methodology applied on a case study map. In light yellow are the fully automatic processes.
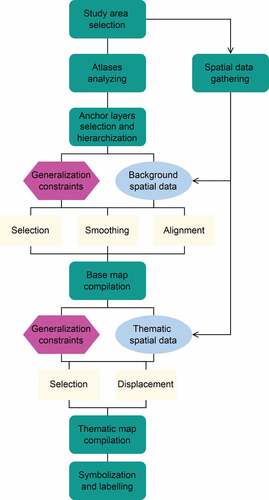
Table 1. Possible conflicts on thematic tactile maps.
Figure 2. Feature priorities for generalization. Dashed lines represent proximity buffers and color represents feature type, e.g. red is coal and green is crude oil.
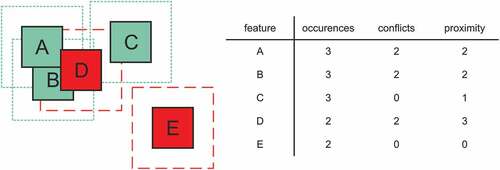
Figure 3. Principles of the random iterative displacement algorithm. When the displacement worsens the symbol overlaps b), compared to the initial state a), it is backtracked. When it gets better c), it is validated and another symbol is chosen and displaced.
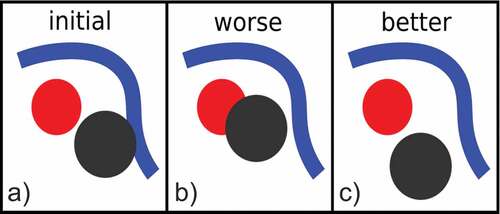
Table 2. Generalization parameters implemented in our case study map.
Table 3. Design parameters implemented in our case study map.
Figure 4. Displacement of lines forming the Hel Peninsula for its enhancement. The original geometry is marked in yellow, the generalized one in magenta.
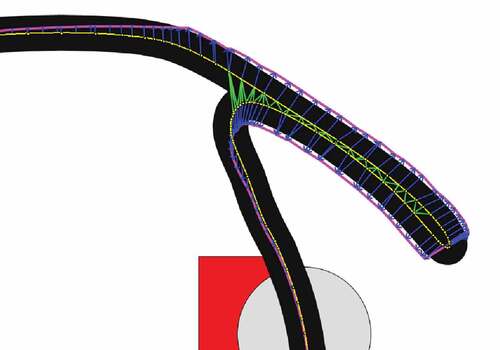
Table 4. Data sources for the case study map.
Figure 5. The non-generalized, original data on a map.
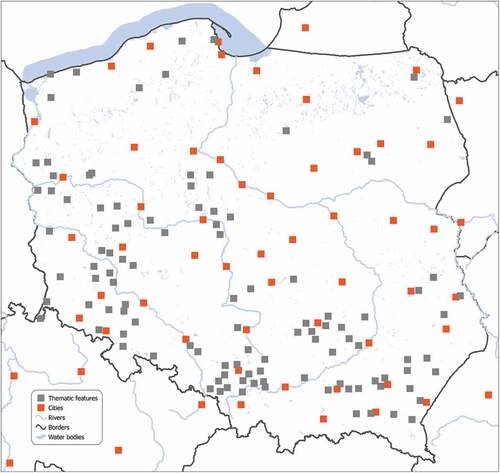
Figure 6. Count of features in the thematic layer before and after the generalization process.
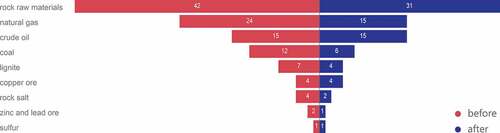
Figure 7. The effect of consecutive generalization steps shown on a map fragment - a) original data; b) data after selection, smoothing and alignment carried out automatically in ArcGIS; c) final data with additional selection and displacement applied in CartAGen.
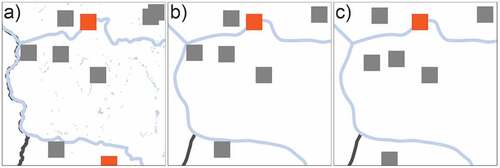
Figure 8. Two types of labels overlap for space saving. Black print labels contain full names, whereas braille inscriptions take the form of 2-cell abbreviations.
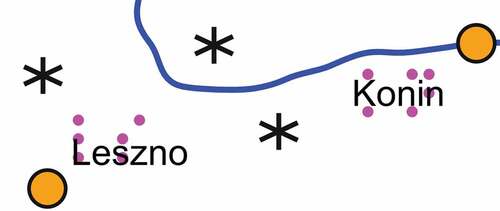
Figure 9. The comparison of map from a) the classic atlas (Cacopulos et al., 2019) and b) the final symbolized map with all the content in graphic form.
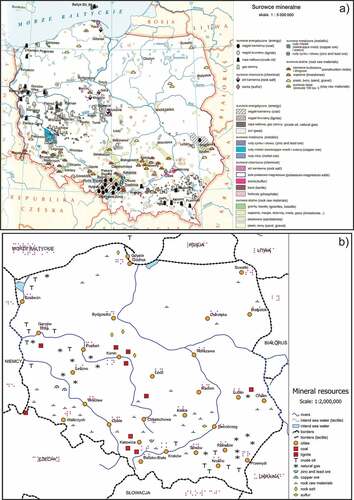
Figure 10. Modification of the border symbol along the shoreline to eliminate ambiguity.
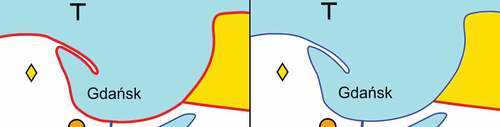
Figure 11. The additional line symbol of border on river on tactile map variant. River is blue, border is red and border on river is brown.
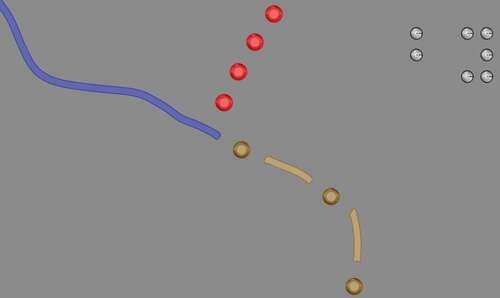
Figure 12. The final design of the graphic map variant.
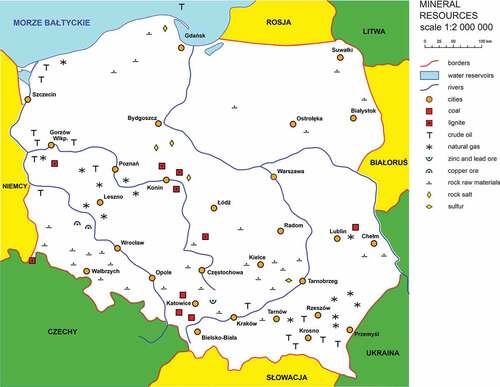
Figure 13. The stereolithography printing process using transparent resin.
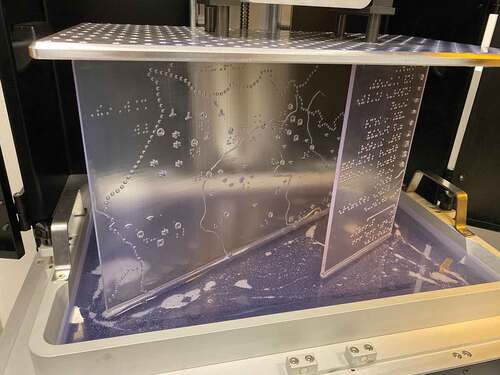
Figure 14. Assembled map legend fragment. Transparent tactile layer visible over the graphic underlay.
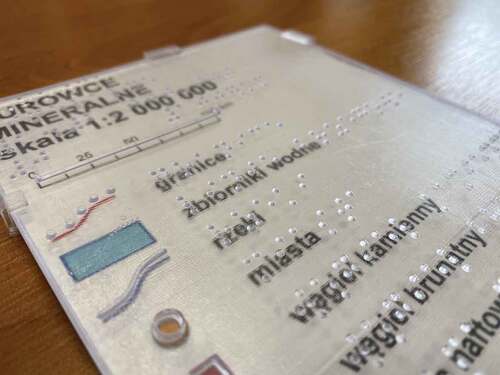
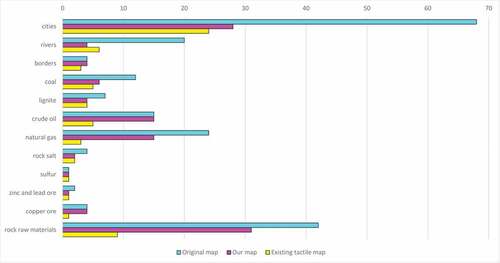
Figure 15. The occurrences of particular symbol types on the analyzed map variants.
Data availability statement
The resulting maps in the form of both 3D models and flat vector drawings, as well as the Python algorithms used for basemap and thematic data generalization are available at the dedicated repository: https://github.com/JakubWabinski/ThematicTactileMaps. The CartAGen plugin repository is available at https://github.com/IGNF/CartAGen.