
Figures & data
Figure 1. Comparison of visual analytics platforms and dashboards in the three key dimensions: input data, analytical complexity, and user interaction for output display.
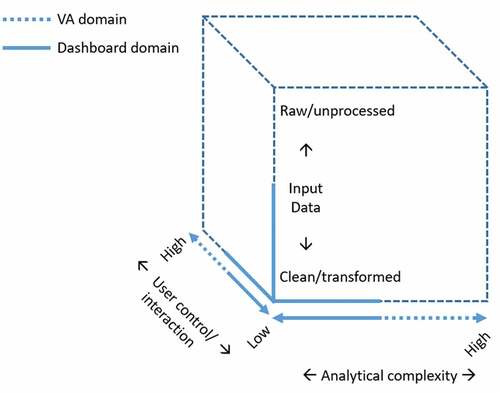
Figure 2. Conceptual framework for big mobility data dashboard design and development.
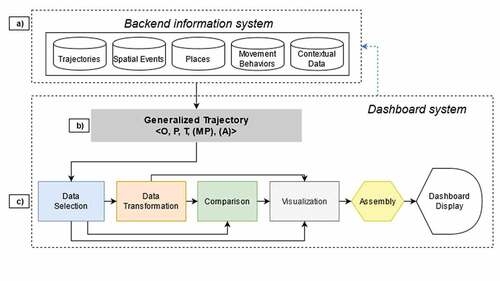
Table 1. Mobility data types and suggested visualization elements in a mobility dashboard.
Figure 3. A dashboard for a vehicle insurance company to monitor driver behaviors.
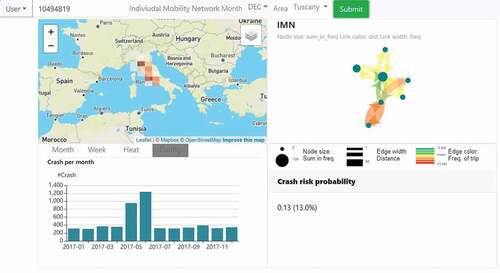
Figure 4. A dashboard for a fleet management company to monitor the activity of trucks. a) the view for fleet operators; b) the view for high-level managers.
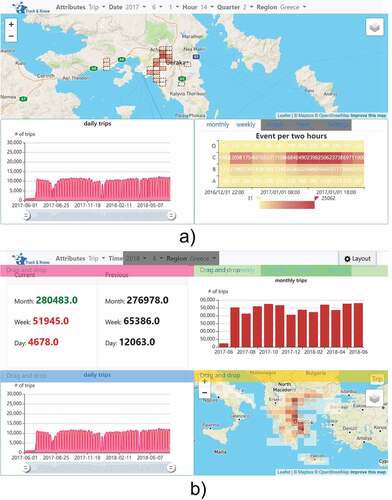
Figure 5. A dashboard for a hospital to evaluate resource-allocation model results.
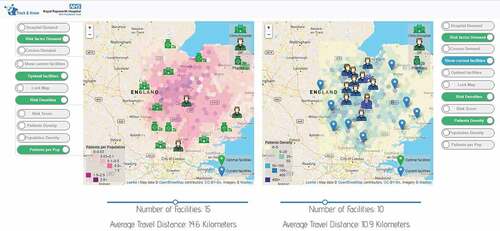
Figure 6. Interface of Toronto Transit dashboard (https://totransit.ca/).
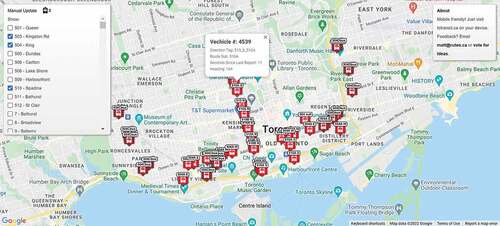
Figure 7. Interface of Euro-Argo project dashboard (https://fleetmonitoring.euro-argo.eu/dashboard).
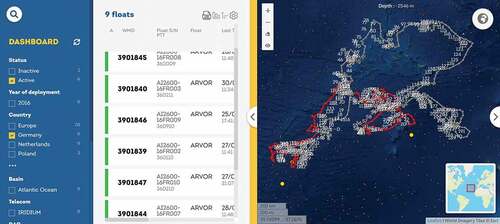
Table 2. Main input data sources and their generalized trajectory models for Dashboard 1.
Table 3. Data selection processes for Dashboard 1.
Table 4. Main input data sources and their generalized trajectory models for Dashboard 2.
Table 5. Data selection processes for Dashboard 2.
Table 6. Main input data sources and their generalized trajectory models for Dashboard 3.
Table 7. Inferred input data and their generalized trajectory models for Dashboard 4.
Table 8. Inferred input data and their generalized trajectory models for Dashboard 5.
Figure 8. Interface of jobs in the Netherlands dashboard (https://dashboards.cbs.nl/v1/commutingNL/).
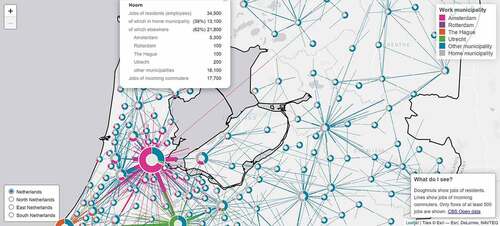
Table 9. Inferred input data and their generalized trajectory models for Dashboard 6.
Data availability statement
Data used for Dashboard 1, 2, and 3 are not available due to both legal and commercial restrictions. Dashboard 4, 5, 6 are from third-party authors who are not affiliated with this manuscript. Data availability of Dashboard 4, 5, and 6 is subject to the creators of the dashboards.