
Figures & data
Figure 1. a) Orthographic 2D flood map stimulus, b) perspective 2.5D flood map stimulus.
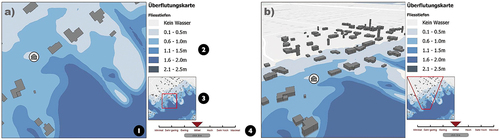
Figure 2. Risk rating (y-axis), split by display perspective (2D vs. 2.5D). The white line in the box represents the median, thus 50th percentile of the data; the box edges represent the 25th (bottom) and 75th (top) quartiles, respectively.
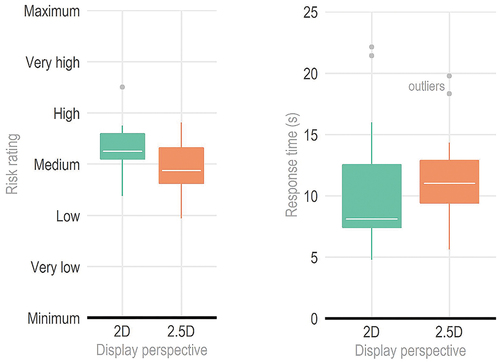
Figure 3. Linear mixed-effect model: predicted values of average risk ratings across the experimental groups are not affected much by participants’ risk attitudes.
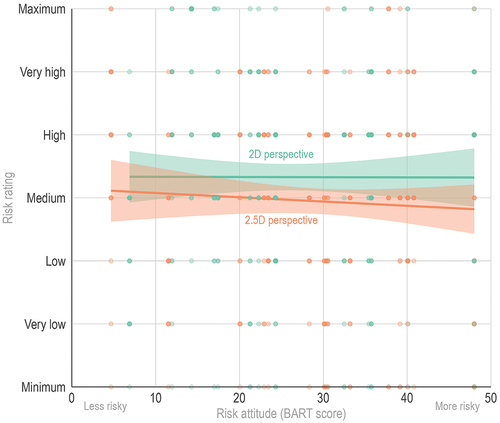
Table 1. No significant differences in risk taking behavior across experimental groups.
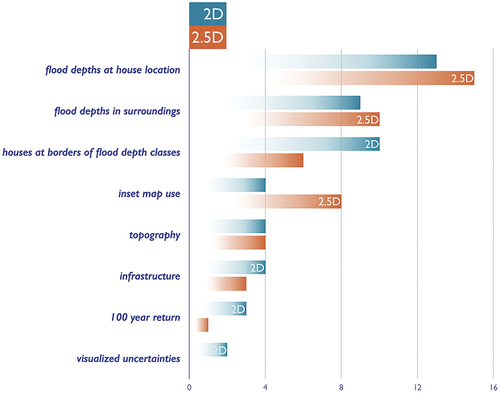
Figure 4. The frequency of responses (x-axis) across experimental groups (2D vs. 2.5D), tallied and ranked from most (top) to least (bottom) in the bar chart, with respect to concepts elicited during participants’ think aloud. Visual inspection of the flood depth at the house marker location was mentioned most by participants during their think aloud.
Data availability statement
The data that support the findings of this study are openly accessible at the OSF archive, available on the Web at: https://osf.io/meznc/.