
Figures & data
Figure 1. Examples of map stimuli for the three visual variables hue, value, and transparency in Part I.
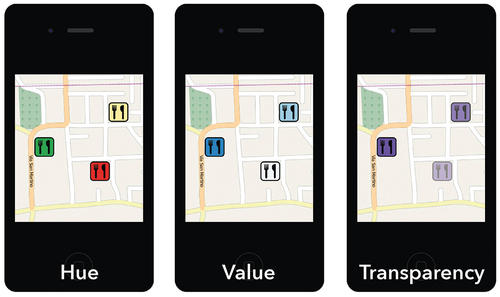
Figure 2. Experiment design: Part I (bottom-up) and Part II (top-down).
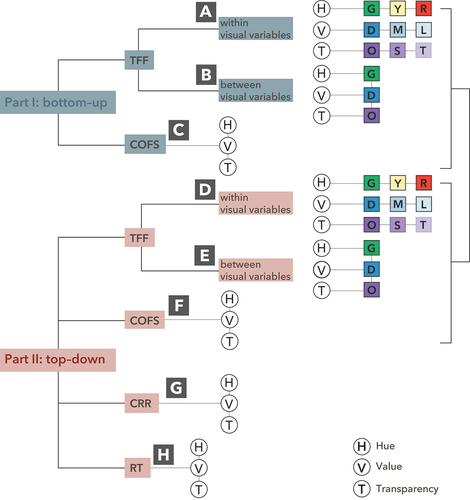
Table 1. Mapping of GR classes to visual variables.
Figure 3. An example of a map for the visual variable value in Part II.
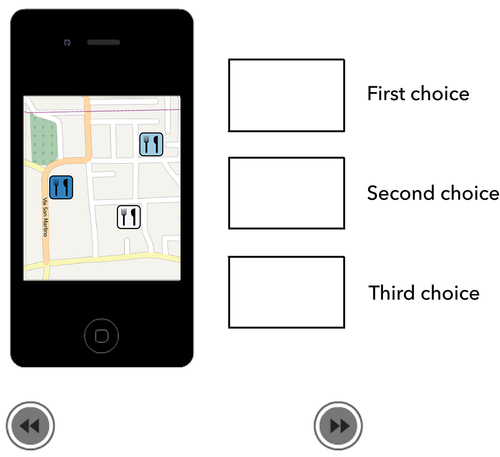
Table 2. Centrality and dispersion measures for time to first fixation (TFF) within the visual variables hue, value and transparency.
Table 3. Centrality and dispersion measures of percentages of correct responses.
Table 4. Centrality and dispersion measures of response time for the three visual variables.
Table 5. Centrality and dispersion measures of time to first fixation for visual variable value and transparency.
Data availability statement
The data that support the findings of this study are available in anonymized form on the open repository OSF https://doi.org/10.17605/OSF.IO/NPGZC.