
Figures & data
Figure 1. The study area and the six planning areas.
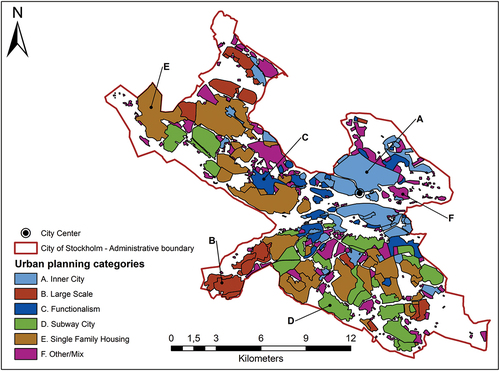
Figure 2. a) Cadastral polygons and buffer zones of residential building; b) fishnet point and buffer zone of OSA fishnet.
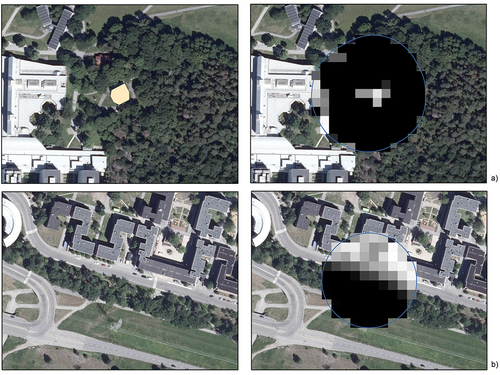
Figure 3. a) Crime rate of residential burglaries; b) Crime rate of street theft.
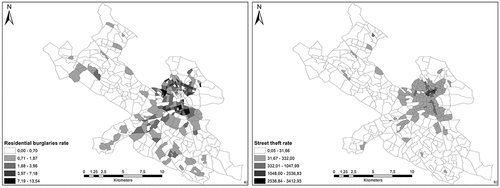
Figure 4. Scatterplots of crime rates a) residential burglaries and b) street theft against their respective GHSL scores by basområden.
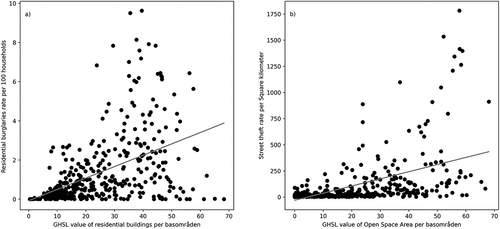
Table 1. Testing for spatial autocorrelation in the residuals of a normal linear regression model.
Table 2. Model results for residential burglaries.
Table 3. Model results for street theft.
Supplemental material
Supplemental Material
Download MS Word (6.5 MB)Data availability statement
The crime data utilized in this study cannot be made publicly available given the current General Data Protection Regulation (GDPR).