
Figures & data
Figure 1. Illustrates the 2nd to 4th level global hexagonal discrete grid generated by DGGRID (Sahr, Citation2015).
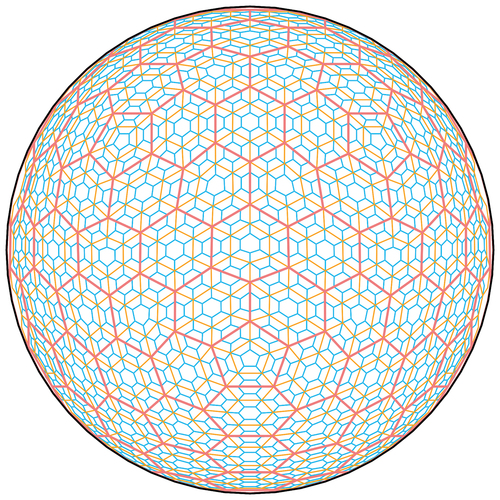
Figure 2. Diffuse query adjacent neighborhood diagram.
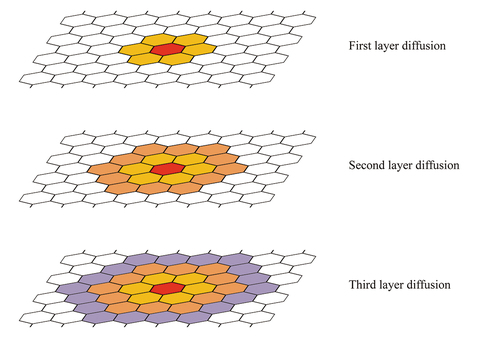
Figure 3. Reclassifying interpolated data, a) Interpolated data; b) Reclassified data.
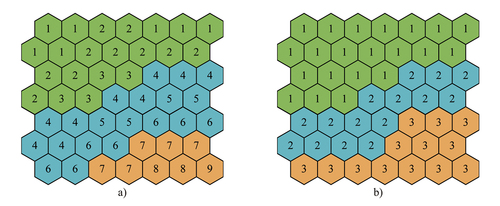
Figure 4. The algorithm of tracing isoline, a) Use flood fill algorithm to set same classification grid cells with same value; b) Extract the outer grid cells of each region; c) Query outer grid cells in higher resolution grid; d) a traced isoline.
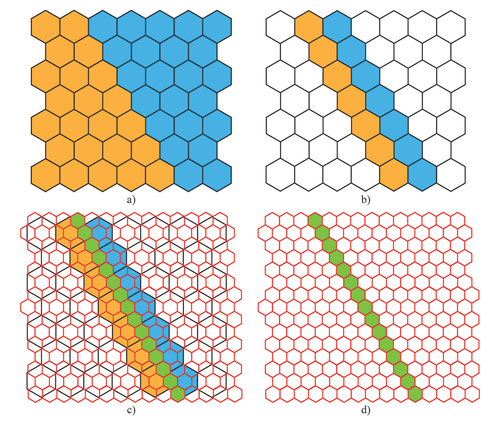
Figure 5. Example output map of SST for January 2021.
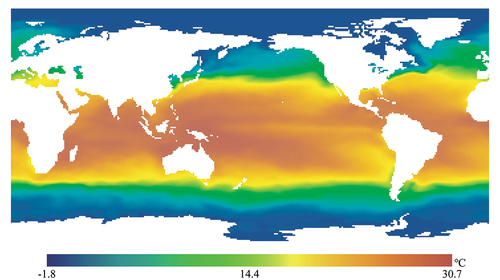
Figure 6. Value classification algorithm.
Table 1. The resolution information of hexagonal and Square Grid.
Figure 7. The comparison of grid classification with hexagon and square grid at level 5 for three ocean regions.
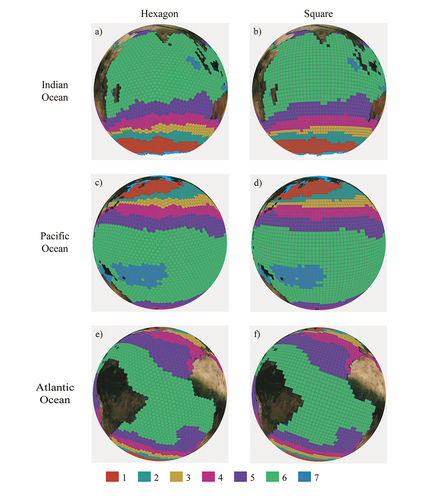
Figure 8. The isoline extraction based on hexagonal and square grid in three ocean area under level 6.
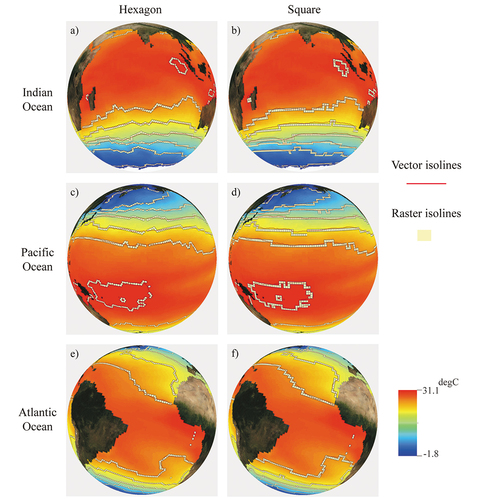
Figure 9. Zoom in details of isoline based on hexagonal and square grid.
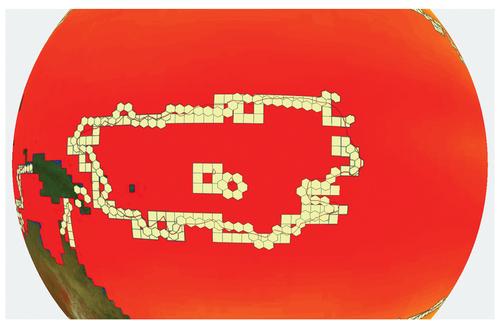
Figure 10. Comparison of MAE values between square and hexagonal grid.
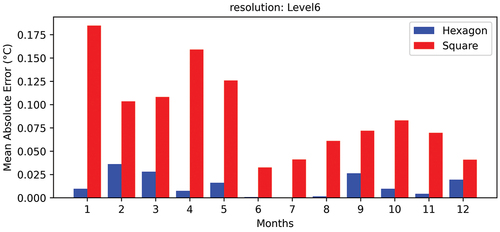
Figure 11. Discussion of grid classification results using hexagon and square grid at different resolutions in the Indian Ocean region.
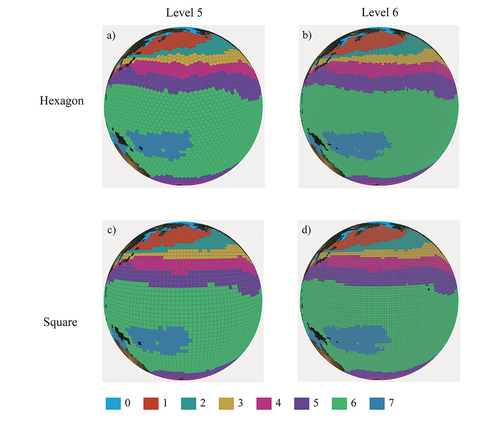
Figure 12. Discussion of isoline extraction results using hexagon and square grid at different resolutions in the Indian Ocean region.
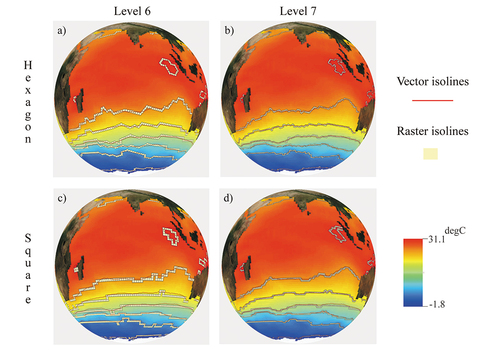
Figure 13. Comparison of MAE values between 4 neighborhoods and 8 neighborhoods.
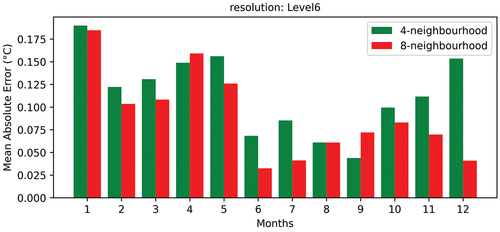
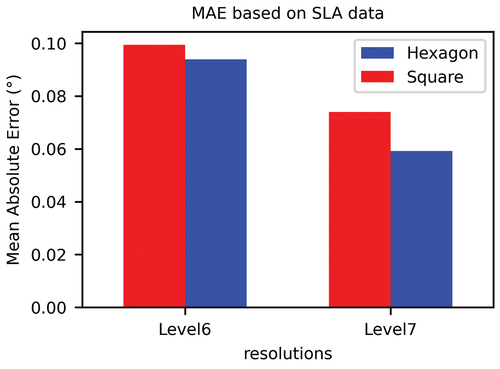
Figure 14. Comparison of MAE values between square and hexagonal grid based on SLA data.
Data availability statement
The dataset is available at https://doi.org/10.5281/zenodo.10574023.